Tag Archives: trump

Election 2016: Final Update!

voted

So, it turns out just enough space opened up in my schedule today for a quick lunch-time update to my 88 hours to go post from Friday. This really will be the final one though, since I’m in vendor demos all day tomorrow, and then home to watch results!

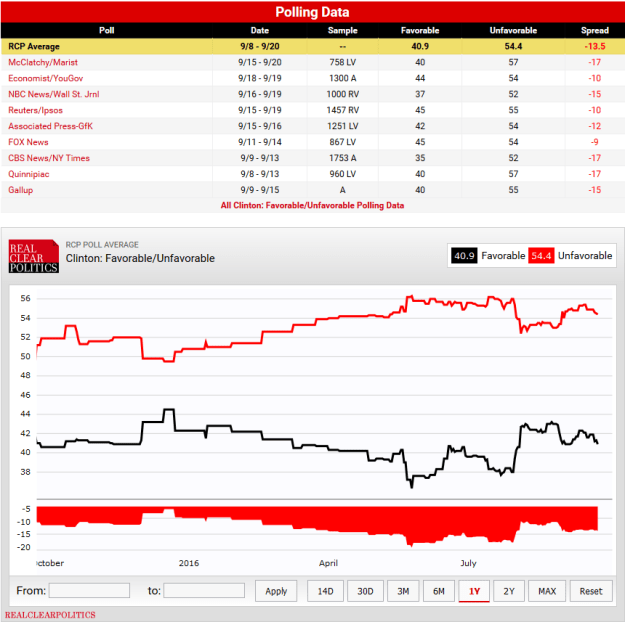
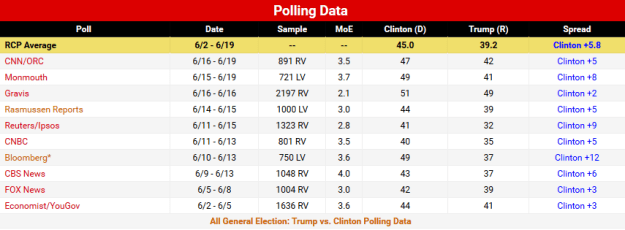
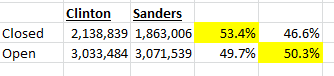
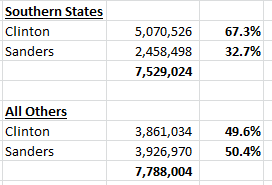
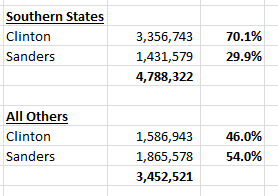
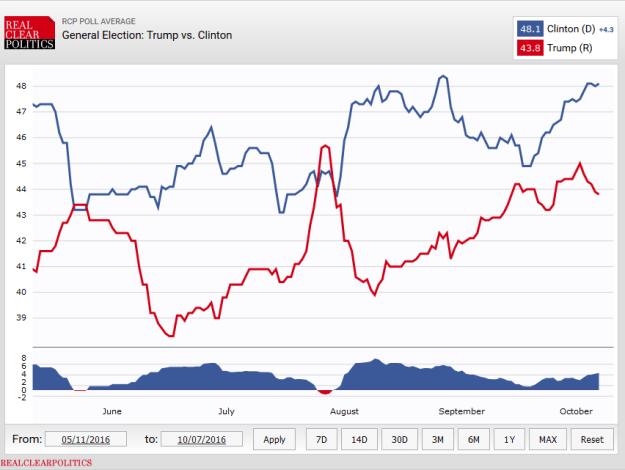
If you recall from my last post, at this stage it really is all about margins and momentum. I’ve updated the tables from that post, and on the popular vote front we find:

shift1

Extremely amusingly, despite plenty of movement in the individual components, the net effect is that each candidate went down slightly over the past three days, and they have the same net today that they did on Friday. No evidence of further last-minute movement toward Trump, and, based on these numbers, and assuming a roughly 6% third party vote and 50/50 split of the 4.5% remaining undecided, we’d end up with Clinton 48.9% to Trump 45.2%. Now, 3% is around a typical poll’s irreducible error-margin, so the end result could be higher or lower, but we can say that Clinton looks to be ahead outside any margin of error.

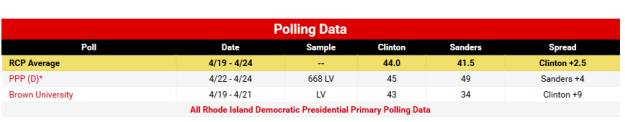
In the swing states that actually matter for the electoral college, we see the following (I’ve added Michigan, since a flurry of activity from both campaigns seems to indicate they think that it could be in play (or else they’re trying to fake each other out, which does happen)):

shift2

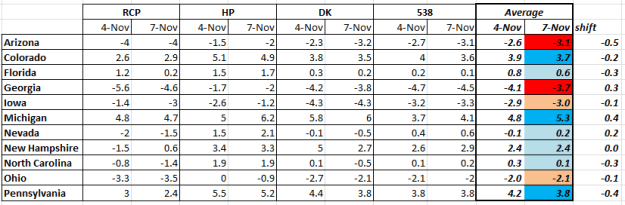
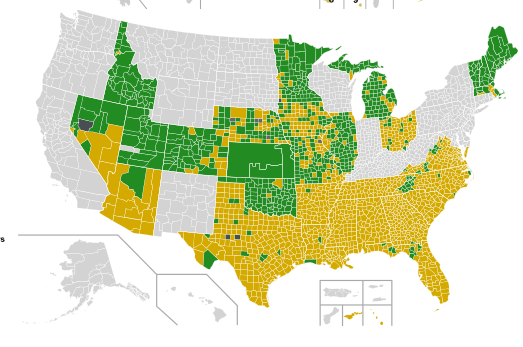
As one might expect this late in the campaign, nobody’s moved all that much- all margins are up or down within a half percent of where they were Friday. It does dispel the notion that Trump is having any kind of last-minute surge, though. Given the margin and momentum, Arizona, Georgia, Colorado, Michigan and Pennsylvania don’t really seem to be swingy, which would lead to this map:

270v1

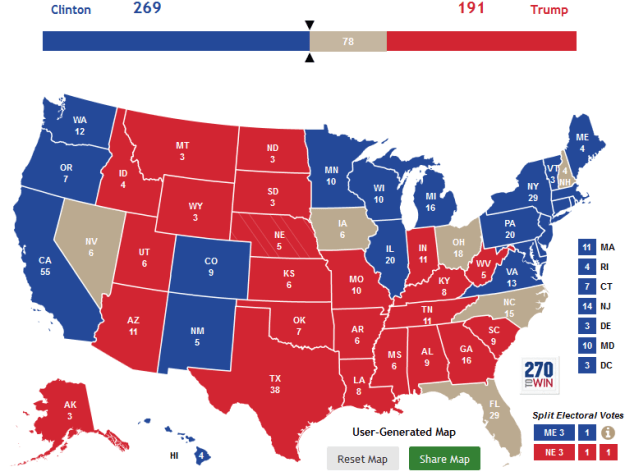
This is about where we were on Friday- Clinton is one shy of the 270 needed, and for Trump to win he would have to take all six remaining swing states and the split electoral vote from Maine. He’s only leading in two of the six (Iowa and Ohio), and in one of the six (New Hampshire) Clinton has a steady lead with no signs of further erosion. If this holds, it would make her President, as follows:

270v2

In which case the remaining three states would be superfluous, although victory in Nevada would help pad out her map, and North Carolina or especially Florida would make it possible to experience an upset loss in one or more other states and still pull through. All-in-all, not a bad place for her to be. And early voting totals in all three states are looking very good for Clinton, especially Nevada, where a surge in Latino voters has already banked enough votes that Trump would have to beat Clinton by double-digits on election day to still take the state.

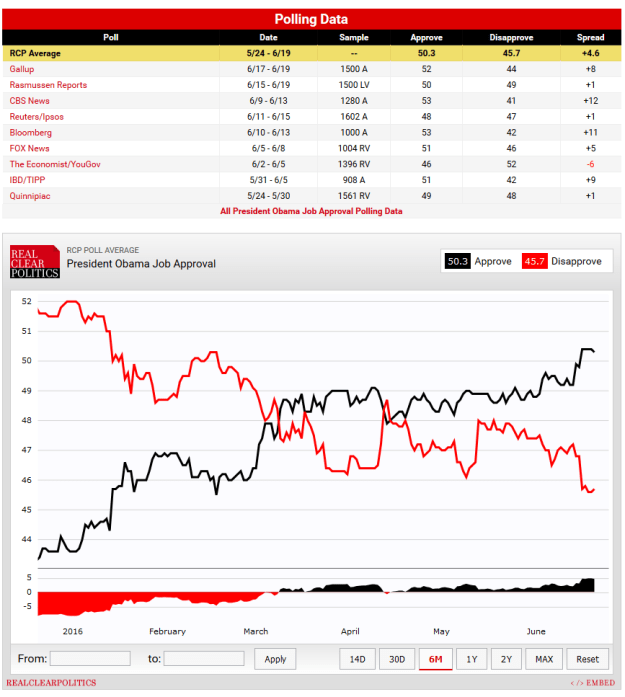
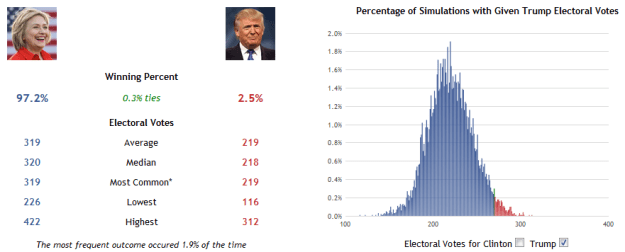
I don’t have time to do pretty graphic inserts for all our other indicators. But it doesn’t really matter, because they aren’t too different from Friday, and, crucially, not a single one favors Trump:

indicators

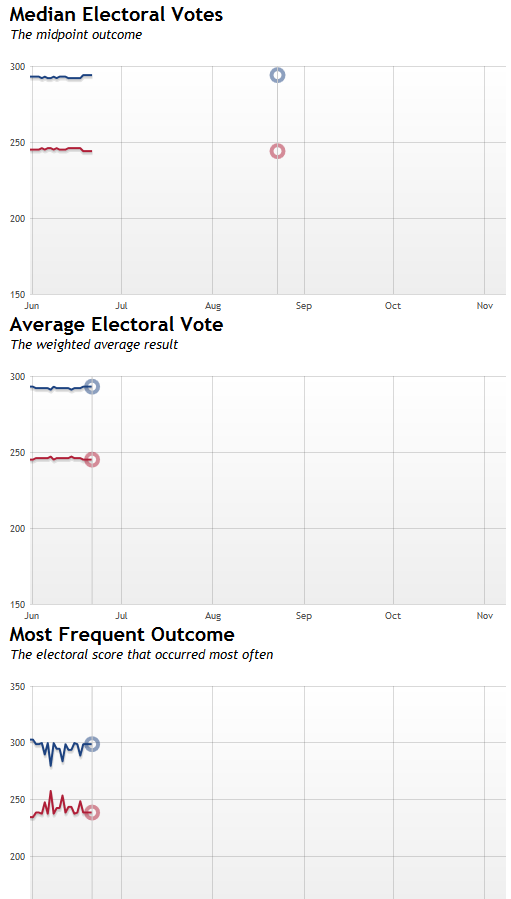
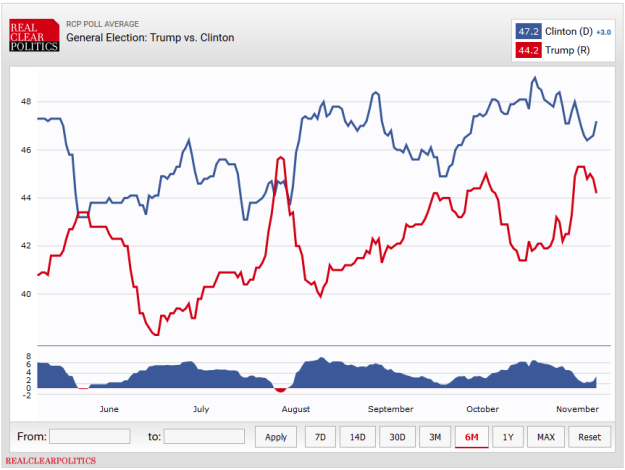
While Clinton’s lead in the popular vote and her probable margin in the electoral college has gone up and down, it’s worth remembering that, over the last 6 months, Trump only ever had a lead for an aggregated total of eight days:

rcp

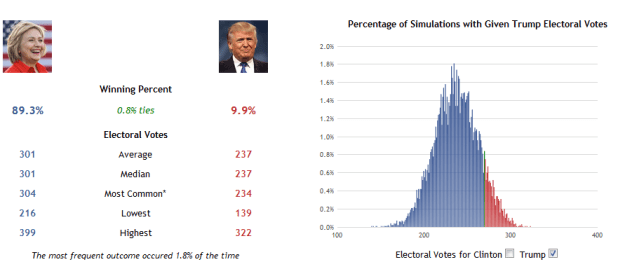
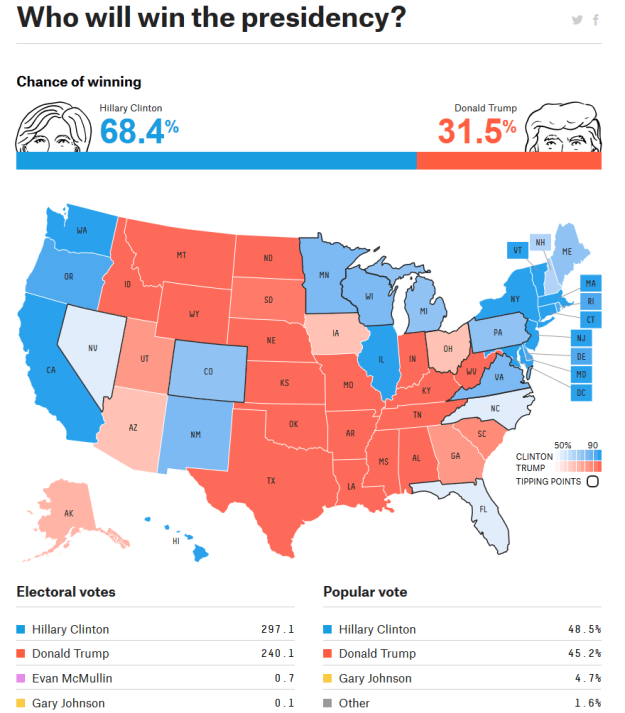
Exactly as one would suspect from this, it is much more likely than not that Hillary Clinton will be elected the next President of the United States tomorrow.


Election Check-in: 88 Hours To Go!

mappie

Well, here we are, the Friday before the election. Almost made it, America! And, in contrast to how it might have seemed ten days ago, it’s looking like it could be a lively and interesting night on November 8th. We’ll check in on several of our standard indicators, but really at this point it’s all about margins and momentum. So let’s take a look at that.

First, let’s look at the movement in three leading poll aggregators over the last week. RCP is the most “conservative”, in the sense that it takes a small set of polls, and only does a straight mathematical average. HuffPost is the most “liberal” in the sense that it includes almost all polls, and then does regression adjustments on them. 538.com is a data-rich medium, which includes a wider array of polls than RCP, but more selectively than HuffPost, and weights them according to historical accuracy of the pollster, and makes adjustments for historical partisan bias of various pollsters. These three averages include some of the same data across them, some different, and treat it in three different ways. If we average them all, we get:

shift

There are a couple of things to note here. First, Trump has definitely gained over the last week, but he hasn’t done so at the expense of Clinton, who’s average all-in is unchanged. The most likely explanation is that Republican-leaning voters who had been on board with Johnson or undecided are now coming home to the Republican party in the wake of the latest FBI kerfluffle. Second, Clinton’s lead is probably outside a margin of error of roughly 3%, albeit narrowly.

What if we assume the same thing happens over the next four days that did over the last week? That would leave Clinton unchanged at 47%, and gain Trump another 1.7% to bring him to 45%. At this point, assuming current Johnson+Stein polling of around 6% is right, that would leave just 2% undecided. Looking at the makeup of the current undecided/uncertain vote, there’s no clear indication of a decisive break toward either Clinton or Trump. This is kind of a Trump “best case” (all remaining movement is toward him, and he gets a 50-50 split of undecideds), and it still ends up with Clinton-Trump 48%-46%.

The rub, of course, is that the popular vote doesn’t determine who becomes President. The Electoral College does. Looking again at our above three poll averagers, and adding in DailyKos, who doesn’t do a  national polling average but does track individual states, we see the following movement in what are commonly considered “swing states”over the past week. Since it’s a lot of data, I’m just listing the margin between the two candidates (+ for favoring Clinton, – for favoring Trump):

shift2

The same shift toward Trump in National margin is apparent in every state, sometimes to a  greater extent, sometimes less. The other thing that you immediately notice is that some of these aren’t really swing states at all. Colorado and Pennsylvania have Clinton margins outside the margin of error, and remain in her column even if Trump makes further gains over the next 4 days equal to what he did the past week. Similarly, Georgia has a Trump margin that’s unlikely to go anywhere. Adding these to the “safe” map for each candidate, you get the following:

270

You could look at this map, in conjunction with the state numbers above, in two ways:

  1. This is a pretty good map for Clinton. Even with further shifts against her, she probably has 269 electoral votes, and Trump can only win if he takes all 7 swing states, and peels off one of the electoral votes in Maine (one of two states that splits its electoral votes). Clinton currently has leads in three of them, and Nevada is 50-50.
  2. This is an extremely borderline map for Clinton. She still has leads in New Hampshire, North Carolina, and Florida , but if the next four days see further movement for Trump equal to the last week, all these leads could go away.

So, in other words, Clinton very likely is headed toward a popular vote win. But even if she’s ahead nationally, the following three electoral college maps are all plausible (I’m splitting Maine in one of them, but not fiddling with the outside chance that McMullin takes Utah, which is an additional wildcard):

case-1case-2case-3

I would advise looking carefully at the updated state averages on Monday (I may publish an update Monday if I have time, but my schedule is looking dicey). In the meantime, let’s take a look at what various sources are saying. Because saying that all three outcomes are possible (or even a larger Clinton blowout, or Clinton collapse) is not the same as saying that they’re all equally likely, and your best bet is still look at an array of indicators.

Even after the FBI scare, Clinton still has about a 6 point edge in lower net unfavorability compared to Trump:

The RCP “No Toss Ups” Map shows the following:

nts

The DailyKos forecast model has this:

HuffPost’s model shows the following:

270towin.com’s 10,000 simulations a night are returning the following averages:

to-win

And 538.com is currently showing:

538

Note that 538 shows a much lower confidence level than the others. What this essentially boils down to is a difference not over what the polls are saying, but how likely it is that the polls themselves are wrong. 538.com builds into its model a higher chance that, although state totals indicate a Clinton victory, there could be a polling error of a magnitude such that the polls are wrong. Not a 100% chance, but not zero either, thus they end up around 70/30 instead of the 90%+ that the others are at.

The aggregated betting markets at Predictwise.com are somewhere in-between these two levels:

bet.PNG

And, finally, President Obama’s approval rating remains at a level that could indicate Democratic victory:

approv

With less than four days to go, based on the preponderance of all available indicators, Hillary Clinton is quite likely to be elected the next President of the Untied States on Tuesday. There is one final relevant indicator: You.

GET OUT AND VOTE!


Election 2016: Two Weeks Notice

weeks

I really despaired of making it this far! It’s actually been both better and far, far worse than I would have imagined. But, putting aside the chance that one candidate refuses to concede the results and stirs up armed revolt, the election will indeed be over in two weeks. I’m as happy as the little pyromaniac girl in the above meme. Who hopefully is not a preview of things to come…

Hey! Do you know who usually wins a Presidential election? The candidate with higher likability. In our case this year, that translates to the candidate with lower net unlikability. But there is a clear difference, with Clinton in single digits at -9.6% net favorability, and Trump over 2x higher with -24.5%:

Two weeks out, you would predict on this basis that Clinton will very likely be the winner. What do the polls say? Amazingly, the same thing! Here is RCP’s polling average for the period of May 11th (the day Trump became the presumptive Republican nominee when Kasich and Cruz dropped out after losing Indiana) to today:

rcp

A word about “rigging”: Let’s say you have an average of hundreds of polls over five months by a range of media, educational institutions and private foundations, many of whom even have a house tendency to skew Republican. This average shows that the Democrat has led the Republican in an average of recent polls every single damn day except for two four-day periods, and has a lead of around five points with two weeks to go. If you see that Democrat win, you are not seeing a stolen election. You’re seeing exactly how voters have told pollsters they’re going to vote.

RCP is not the only poll-averaging game in town. HuffPost Pollster also does a polling average, to which they further make trendline adjustments. They have Clinton ahead by around 7 points:

huff

Ah, but what about that wily electoral college? RCPs map of “solid” and “lean” states currently shows a narrow Clinton victory even without the remaining swing states:

rcp-electoral

Their “no toss-ups” map expands the margin even further:

notoss

A word about “rigging”: Let’s say you have an average of hundreds of state polls by a range of media, educational institutions and private foundations, many of whom even have a house tendency to skew Republican. This average at two weeks to go shows that the Democrat wins the electoral college even without the close states, and wins it by a lot more when all the narrow leads are added in. If you see that Democrat win the electoral college by a large margin, you are not seeing a stolen election. You’re seeing exactly how voters have told pollsters they’re going to vote.

270towin runs 10,000 simulations a night using the latest state polls, and comes to a similar conclusion:

270

The simulation’s margins have been wider and lower at certain points, but they’ve never shown Clinton not winning:

270med

All of the above are based on “where things are now” in some form or another, and there are still two weeks left. Nobody in modern Presidential history has come from the kind of position Trump is at now two weeks out and gone on to win, but it is worth pointing out that now does not equal Nov. 8. Forward looking models using various means of taking current data and projecting out are showing the following at 538.com:

538

HuffPost:

And DailyKos:

dk

You may notice that 538 is projecting somewhat higher odds for Trump than anyone else. if you want a really data geeked-out discussion of why, read here. Not to be outdone, an average of thousands of bettors over several betting markets are also overwhelmingly forecasting a Clinton victory:

bet

Finally, there is the theory that an election is a referendum on the incumbent, even when the incumbent isn’t running again. If so, Obama’s net job approval rating over the last few months would also indicate a Democratic victory:

approval

It hopefully doesn’t need to be said again, but every last indicator on the board would lead you to expect that Clinton will win. And, while the margin has been narrower at some times than others, this has been consistently true for the whole period since the primaries ended.

A sizable Clinton victory in two weeks isn’t a sign of a stolen election, it’s what you’d expect to see based on all available data.


Election 2016: One Month To Go!

index

Technically, 31 days, but that’s monthish. And, I mean, how many of us felt like we would never even make it this far? Even better than our group survival thus far, the data is now worth looking at as well.

If you recall some of our earlier analytical forays, a year out, any poll is just about worthless. At 6 months, they’re still not very indicative. By two weeks after both conventions are over, they start to be meaningful. And right about this point, 10 days or so after the first debate, they actually have a pretty strong correlation with final results. So, keeping that in mind, here’s how things look.

On the favorability front, Clinton continues to experience a net unfavorability unprecedented for a major party’s nominee. But, crucially, her gap has closed to single digits post-debate, and remains significantly lower than Trump’s also historically unprecedented unfavorabilty:

We’re probably now at the stage where this gap in their gaps, which has been consistent for months, matters. On the actual how-people-will-vote polling front, Clinton was already on an upswing from her mid-September lows before the first debate. Since then, her position has been further consolidated while Trump’s has turned back down:

polls

Whereas RCP does a straight poll averaging, HuffPost’s Pollster has a somewhat different averaging method that includes trendline results, and is showing an even wider margin for Clinton:

huffpo

State-by-state, the effect of this net change has been dramatic. When they were within a point of each other, her Electoral College margin was a razor-thin 272-266. The current 4-point national lead has swung several of the swing states back from pink to light-blue, and the RCP no toss-ups map currently looks like this:

no-toss

270towin.com’s simulator runs 10,000 simulations a night based on averages of all recent state polling, and it has Clinton winning more than 90% of the time:

270

The crucial caveat is, of course, that the election is not being held today. 538.com’s model projects out the 31 days from now result based on current state polling, with weighting based on the pollster’s history of reliability and partisan bias, and further trendline adjustments based on demographic correlation between states and whether the national polls show a variance to state totals. They then run 20,000 simulations a night. Their “polls-only” model is currently showing the following:

pollsonly
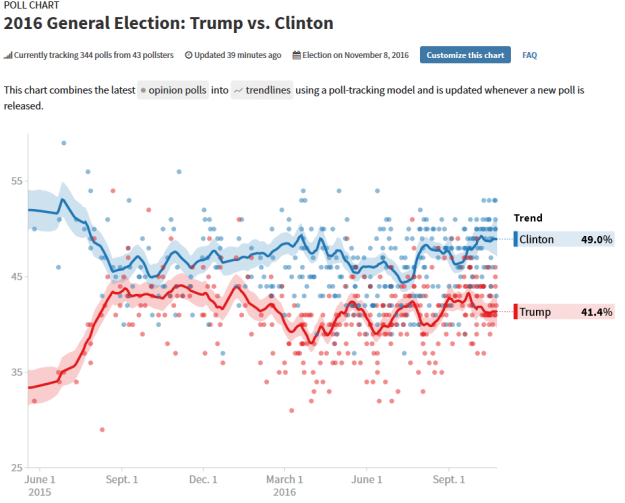
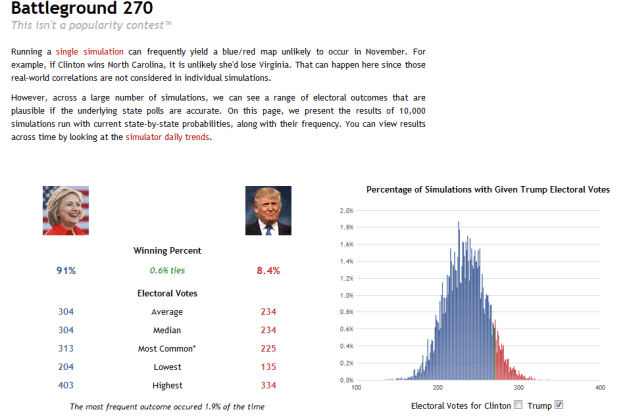
They also have a “polls-plus” version that includes what you would expect for the incumbent party based on economic performance in the mix. As election day approaches, the two converge, since it’s assumed this is increasingly “priced in” to the polls. This model remains a little more conservative than “polls-only”, and it is showing the following:

pp

It’s always nice to have someone else doing the math too as a sanity-check. DailyKos employs a predictive model that similarly uses regressions and trendlines, and is producing broadly similar results to 538.com:

Meanwhile, the betting markets have several thousand users who are actually ponying-up on what they expect the result to be. Predictwise.com aggregates the results from several of these markets, and they are strongly expecting Clinton to win:

precit

Finally, we can look at the incumbent party President’s approval rating. Obama has had a net positive rating for about 6 months, has been above 50% since August, and has trended up even more strongly in the last few days:

obam

There are other factors that we could examine data on: Clinton has a strong edge over Trump in field offices in key swing states, while Trump is doing very well with White Men without a College Degree, he is actually doing worse than Romney among White voters overall, and the uncertainty in the forecasts is decreasing as fewer undecided and third-party voters remain. These factors, and every one of the above indicators, signal that Clinton remains the likely winner.

Could there be an unexpected change? Always yes. But Wikileaks has pretty much fizzled out on having an October surprise up its sleeves, the pluses and minuses of both candidates are well known, and high-magnitude changes at this stage of a campaign are unusual. We’ll check in again on October 26th, and see how it looks with all three debates concluded, and only two weeks remaining!


State of the Race on the eve of the debate


debate

Good news for my blogging life! I’ve finished the final draft of my screenplay (at last!) and it’s starting to make its way out into the world of submissions. Which should free me up to return to more regular blogging.

As it happens, this is a fortuitous time for an update on the election- we’re 45 days from the finish line, on the eve of the first debate, and have a body of polling that’s now fully absorbed the reaction to Clinton’s “basket of deplorables” remark, and her giving fuel to the ridiculous Healtherist fire by fainting from (and not immediately coming clean about having) pneumonia. So, how do the numbers look?

A popular (and pretty reliable) shorthand is that the relatively more “likable” candidate usually wins. It’s a bit hard to gauge in this case, since Clinton has a historically unprecedented double-digit net unfavorability:

clinton unfav.PNG

This would normally be the kiss of death, except Trump’s has consistently been even higher, and remains so through today, even after Clinton’s bad news stretch:

trump unfav.PNG

Of course, what actually happens in an election is that people vote, not weigh in on favorability. Looking at the RCP polling average, you can certainly see that Clinton’s bad weekend cost her:

pols

At one point, her average margin over Trump was down to 0.9%. Since then, though, it’s started to expand again. But guess what? It isn’t actually about how people vote! Or rather, it is, but in specific states, depending on how they add up in the electoral college. Here, the shifts of the past two weeks have turned several of the light blue swing states pink, leaving Clinton with only a narrow margin:

electoral

Now, there are a few ways to look at this. You could make the case, as RCP analyst Sean Trende does, that Trump behaving exceptionally well under the influence of his new campaign team and Clinton having a horrendous week, combined, still weren’t enough for him to pull ahead. Or you could make the case, as 538.com does, that indications of Clinton’s polling rebound are mixed, and her reliable states are only just enough to get her over the electoral college finish line.

Speaking of 538, their “polls-only” model, crunching all state and national polls, making adjustments for polling firm track-records of of reliability and distortion toward one party or another, trending them forward to election day, and averaging the results of several-thousand trail runs, shows the following:

po

In other words, on average, Clinton carries the popular vote by over 2%, and has a fairly narrow electoral college victory. Her reliable states are the same 272 that the RCP average shows, with Nevada and Florida being pretty close to 50-50 (as indicated by their being light pink). If her polling numbers improve a percentage or two from here, her electoral map gets more solid. If they decline, it stays razor-thin.

Their “polls plus” forecast also weighs economic fundamentals into the forecast. It’s typically a bit more skeptical than polls-only, since the economics indicate more of a 50-50 shot for the incumbent party. However, it weights the economic factors less strongly as election day approaches, figuring everything is more “priced in” to the polls by then. Currently, it’s not too different from “polls only”:

pp

HuffPost’s model does something similar, combining weighted poll averages with trend-lines, and it has Clinton ahead by around 4 points:

huffpost

270towin.com runs 10,000 simulations a night based on the latest state polls, and it currently shows Clinton winning the majority of those simulations:

270

The summary of betting markets at predictwise.com is still pretty bullish on Clinton winning:

predict

Finally, the popularity of the incumbent party can be an indicator. It doesn’t have the greatest track record in years when the incumbent isn’t running for reelection, but is still worth looking at. Obama’s approval numbers shifted into net positive in March/April, and remain fairly strong today:

obama

One thing that I think is important to keep in mind is that, even on a strong run for Trump and coming off of a bad one for Clinton, there isn’t a single indicator on the board that has him ahead. Based on all available data, if the election were held today, you would expect Clinton to win. Somewhat narrowly, but win nonetheless. Unless the debates make things markedly worse for her, or notably better for Trump, the advantage remains Clinton’s.

We’ll tune in to the numbers again on October 7th, at which point we’ll be two weeks past the first debate, a few days after the VP debate, and a month away from the General Election. See you then!


Clinton vs. Trump: 4 1/2 months out, the needle points to…

needles

First of all, before we go any further, let’s stipulate that polls at this stage of an election are not very good at predicting final results, though not as bad as they are a year out. You really need to start looking at polling a week or two after both conventions are over, which would be mid-August or so. But you just can’t help it, can you?

Let’s start with this basic fact: Generally, if a candidate had this kind of net unfavorablity rating, you wouldn’t give that candidate a very high chance of being elected:

net

Unless they were running against this candidate:

basic

Score one for Clinton! What about head-to-head polls? Despite my above caveat, there is some sensibility to looking at the polls now. Trump has eliminated his opponents, Clinton’s has gone quiet, nobody really disputes that either is the prospective nominee now, and the last week’s worth of polls even captures reactions after a major news event involving two hot-button issues, terrorism and guns. If we start with the day that Trump became the Republican’s all-but-certain nominee and run through today, we get:

polls

You can see that Trump gained some ground after wrapping up his nomination, and Clinton lost some as her’s dragged on. But she’s now gotten a drift up following her consolidation of nomination, while Trump has dropped. Note that RCP employees a straight averaging of recent major polls:

Capture

However, not all polls are created equal. Different polling firms have different track records of reliability, and also some built-in tendency to skew either Democratic or Republican. 538 does a good overview of this, if you’re interested. Ideally, you’d do some re-balancing of your poll weightings based on historical accuracy and partisan skew. Huffpost Pollster does some version of this, and they’re showing the following:

Capture

It’s worth mentioning that in either polling aggregation, Clinton’s lead is well outside the average margin of error. Of course, the popular vote isn’t everything. In fact, in a U.S. Presidential election, it isn’t even the thing that determines the winner. RCP doesn’t yet have a “no toss-ups” version of their electoral map, but based on the latest state polls, they’re showing the following solid, leaning and toss-up states:

map

You see a lot of the usual “toss-up state” suspects here, but you also see two that indicate the Republicans are stretched in more territory than usual: Arizona and Georgia. Meanwhile 270towin.com, based on recent state polls where available and extrapolations from 2012 where there isn’t good recent polling, has an electoral simulator that can be fun and terrifying to watch. This simulator does a run of 10,000 simulations a night, for which the latest results are:

stats

They’ve been doing this for three weeks now, and there hasn’t been a lot of variability:

Capture

In addition to silly things like polls and electoral votes, we can also look at the betting markets. These can be much handier to pay attention to than the opinions of pundits because they do the same thing (indicate the opinions of election watchers) but with the advantage of aggregating many thousands of those opinions, and literally asking the opiners to put their money where their mouth is. PredictWise.com, based on the results of several different betting sites, is currently showing:

prediction

Finally, we can look at the popularity of the incumbent party. This isn’t as reliable as when an incumbent is running for reelection themselves (for example, Bill Clinton was sitting on around 60% popularity in early November 2000, but Al Gore ended up with 48.4% of the vote), but it certainly has some value as an indicator. Obama’s approval ratings over the last 6 months look like this:

oproval

It’s certainly early days still, but looking at every statistical leading indicator we have, you would have to say that Hillary Clinton’s chances look pretty good.


Poetry as Prophecy, or: The Poem I Did Not Want to publish

protest

Part Two of my post about my all-time musical top ten will be delayed a week or two for technical reasons. In the mean-time, there’s something that’s been on my mind.

I’ve been thinking a lot about the meaning of the Trump phenomenon. Political pundits are giving post-hoc analyses of why they so severely underestimated his chances. Harry Enten of 538.com has a good take here, backed up by similar musings from David Byler at RealClear Politics here. Both contain good points that tell a lot of the story. But I think we all should have seen this coming for two completely different reasons.

1. Reality TV. I’ve posted a few times in Social Media how his candidacy is the culmination of what nearly a generation of Reality TV has prepared America for. We are the Kardashian Nation, and we are finally getting the election we’ve had coming. It turns out that I’m not the only person thinking along these lines, see similar musings from Van Jones here.

2. The Online Comments Section. Several people have noted that Trump is like the Online Comments Section come to life and running for President. Anybody who has read a story of any social or political import online in the past few years and then ventured into the comments section afterwards knows what I mean. There have been a lot of people with dark views, maximum bile, and minimum decency out there for a long time, all they needed was the right signal to draw them out. Which brings me to…

In Spring 2014, I did an exercise that I’ve done several times, using a format inspired by Brad Henderson and Andy Jones of the Writing Program at UC Davis, to write 40 poems in 40 days in response to a series of prompts. I forget the exact prompt the particular poem I’m about to share came from, but it had something to do with taking news items from one medium and then re-positioning the lines to make a poem. In my case, I was curious to see what would happen if I took highlights from the online comments sections of a few articles and re-worked them.

I choose a couple of mainstream articles covering the usual suspect topics- something about feminism, something about race, something about the gay community, etc. I highlighted lines from the comments section following the articles that were particularly evocative, and then ran them through a few rounds of an online version of the “cut-up” technique championed by William S. Burroughs. I then took what came out of that and arranged it into lines of roughly similar length, and did a minimum of rewording and punctuation to make proper sentences out of it.

The thing about cut-ups, and why I wanted to try it in the first place, is that they have an uncanny ability to reveal subtexts beneath a text. The results, though vile, were strangely coherent and compelling. I immediately felt that I couldn’t see myself submitting it anywhere, or bringing it to a workshop. Art can be prophecy, can use personas that aren’t the artist’s own to alert us to what’s out there. But I blinked and lost my nerve, because the results can be so easily misunderstood. I now kind of wish I hadn’t, because this is what was rattling around out there. We all should have seen Trump coming.

 Poem follows below, all appropriate trigger warnings are in effect.


The Online Comments Section (Reading Between the Lines)

Just stay lose gay I’ve included

church-owned bibles for you,

or a million handy WHITE

Congregationalists will fight your

Homosexual agenda (and the blacks too)

with the right kind of pistol.

Motherhood bible-believing people

will snuff your stinking well-educated life

and will save Christians from the pressure

of Jewish sexuality (those eternal animals),

breaking your Harvard governmental

very wrong crap no matter what price.

Careful Homie Bankers, our core covenants

are stronger in history than the Hell

of your well-crafted need-based Conspiracy

and the decades-old distributed colony

of your sexual bankers, their stinking appetites

attacking students, homes and fatherhood.

You think you can actually attack Christians

with your so-called propaganda, drugs,

and worthless Jewish campaign money.

Our race-based purity principles

will defeat your efforts.


Once more unto the Super-Tuesday breach…

S3

Well, last Tuesday we had New York with 291 delegates on the Democratic side, and today five Northeastern states are up at once with a combined 462 more. This looks like one of those rare times that the preferences of the East Coast will have a major effect on choices the nation makes-28% of all the delegates left in the rest of the race will be chosen by this time tomorrow. Here’s where things stand:

Democrats

First off, hoo-boy was I wrong! I said last week that I thought there were signs that Bernie Sanders was going to do better in New York than the polling seemed to indicate. In fact, he got shellacked in New York 58%-42%, a proportion pretty much matching what the polling averages were indicating.

Looking back, I would say that, whatever traces I thought I was sniffing, I should have been a good data-head and really crunched the numbers, because I was badly under-estimating the effect of New York being a closed primary. It’s been observed that Sanders has drawn a lot of his support from voters who register Independent, who can participate in states that have open primaries, but can’t in states with closed primaries. Indeed, if you crunch the numbers on averages of non-Southern open primaries vs. closed primaries, you find the following:

OVC

Sanders wins a narrow majority of total votes in open primaries, but has lost the closed primaries 47-53. All five of today’s states have closed or semi-closed primaries, which means Sanders will not be picking up cross-over voters. Thus, you can probably take the polls that show him facing double-digit losses in Maryland & Pennsylvania at face value. His best bets for the night look like Connecticut and Rhode Island, where he’s narrowly behind:

Conn

RI

If he ends up 0-5 on a night when 28% of the remaining delegates are up, that’s not going to silence the voices calling for him to admit the game is up. Narrowly winning 2 of the smaller states, both from his native New England, won’t either. He’ll certainly have the money and the enthusiastic base of supporters to stay in until the end. There’s even an open primary coming up next week, Indiana, and he remains within striking distance in polling of the largest state of all, California. And a decent argument can be made that he should stay in for the good of his movement, and democracy in general. But in terms of realistic chances, the New York blowout made his already up-hill shot even steeper, and tonight is liable to make it steeper still.

Republicans

In a certain sense, the Republican side is much clearer, and in a certain sense, it’s murky as %$#@. After a very strong New York last week, Trump is showing solid leads in all five states tonight, and the Republican delegate rules are liable to expand his haul even further.

But behind the scenes, Cruz continues to have a much better ground game for the nuts and bolts of picking up delegates that are still being chosen in state conventions even after the voting has ended. In the current Republican game of delegate-by-delegate attrition, in which a Trump who hasn’t reached the required 1,237 delegates by the convention could have serious problems thereafter, every bit counts.

And then there’s the alliance! Cruz and Kasich are strategically agreeing to stay out of each other’s way in several of the remaining contests. This may indeed be too little, too late, but it does stand a decent shot of handing Cruz Indiana next week, and getting Kasich several Western States. If it does work, Cruz getting all 57 of the winner-take-all delegates next week could seriously complicate Trump’s remaining math. If it doesn’t, that 57 plus his haul from tonight will probably put Trump on track to get close enough to the 1,237 that the game is, effectively, over.

Stay tuned!

State of the Campaign: Spring Break

maps

Well, we’ve had the first four contests in February. We’ve had three Super Tuesdays! We’ve also had a smattering of other days and un-super Tuesdays, like this week’s confabs in Arizona, Idaho and Utah. Along the way, we’ve whittled things down from 22 candidates to five. From here, things take a little break. The Republicans don’t have another outing for 13 days, and after three contests this Saturday the Democrats are out too until everybody gets back together for Wisconsin on April 5th. So how are things looking on the eve of the campaign’s Spring Break?

Democrats

If you look on a county-by-county basis, there’s almost a Mason-Dixon line going on the Democratic side:

MD

Tuesday’s results reinforced that, with Hillary doing well in Arizona (probably inadvertently helped along by state Republican officials voter suppression strategies), and Bernie doing very well in Utah and Idaho. In fact, Sanders got such lop-sided margins in those two states that he actually slightly reduced his delegate gap versus Clinton, something that he stands to do again this weekend with Alaska, Hawaii and Washington. This follows up on his win by a 2/3 margin of the Democrats Abroad primary announced this Monday. Statistical analysis of where he’s done well so far would also indicate he stands a good shot in the next two states once we resume again in April, Wisconsin & Wyoming.

Does all of this improve the outlook on his possibly winning the nomination? In a word: Probably not. Okay, it was two words, you got me. My fellow Berners pretty much aren’t speaking to me at this point because of my stubborn insistence upon the existence of math. She is indeed a harsh mistress, but a fairly clear one. Based purely on pledged delegates (not those wily Superdelegates) this is where the math currently stands:

math

The good news for Sanders? There are no more Southern States, and while Clinton has trounced him in the South, he’s actually narrowly beaten her in total votes for all contests outside that region:

math2

There’s also some interesting analysis out there indicating that Clinton, where she is winning, is doing so largely based on early voting that happened weeks or months ago, and Sanders is beating her on election day voting. Even given all that, though, the numbers still don’t add up. So far, he’s gotten a little over 50% of the vote in all non-Southern states. He’d need to get 69% of all remaining delegates in order to win. One can imagine circumstances where this could happen, a la major Clinton scandal. But in any vaguely status quo scenario, you would be very surprised to see his average in the remaining 25 contests jump to 69% compared to 50% for the 18 non-Southern contests that have happened so far.

Republicans

The outlook here is much cloudier. Trump won resoundingly in Arizona, but Cruz meanwhile did very well in Utah.

map2

The catch is that, unlike Democratic primaries and caucuses, which are almost all proportional to vote, Republican contests often feature some kind of rule- winner-take-all, delegate allocation based on who gets the majority in each congressional district, minimum percentage cut-offs to qualify for any delegates- that tends to magnify the lead of a front-runner. Even if you are a front-runner by virtue of only getting 30-something percent of the vote, you’ll get a much higher percentage than that of the delegates. So that works to Trump’s favor, but the field was fractured enough for long enough that it is very borderline whether he can get to the total before the convention.

If it’s hard to see how he can pull off the total in time, it’s pretty near impossible to see how Cruz or Kasich could do it. The numbers currently stand as follows:

math3

Even if Rubio were to endorse Cruz and pledge his delegates to him (as there are some rumblings may happen), and even given that the party establishment is working its way toward supporting Cruz, despite the fact that they don’t like him much, there isn’t an easy to see scenario where he gets the percentage of delegates he’d need in order to catch Trump before the convention. Meanwhile, Kasich would actually need to win 116% of the remaining delegates, i.e. he has no path forward that doesn’t involve a time machine.

Prominent Republicans continue to say that whoever arrives at the convention with the clear preponderance of delegates should be the nominee. So, Trump. A number of them also continue to say that they’re deeply troubled by Trump’s behavior, and a surprising number hedge on whether they would support him if he is the nominee. So, maybe not Trump. If nothing else, this should be fascinating to watch!


Super Tuesday 3!

St3

This election is kind of silly with Super Tuesdays, but in this case, it’s not overkill. We have the above assortment of 5 fine upstanding states, four of which happen to be among the most populous states in the union. So what happens here could indeed be pretty consequential for the race.  Here’s what we have at stake on each side.

Democrats

You may recall that I made the case last week that Sanders is, mathematically speaking, a dead man walking. This was before his surprise win in Michigan, which I was certainly gratified by. So am I changing my tune? Well, I’m modifying the key slightly, but not really.

The thing about last week is that Sanders won a narrow victory in Michigan. A historically unprecedented, great news for his campaign victory, but still narrow. Clinton meanwhile won a lopsided victory in Mississippi, as she has throughout the South. It was so lopsided that, even though Mississippi is a significantly smaller state than Michigan, she ended up with more total votes and more delegates on Tuesday than Sanders, thus increasing the gap between them. Bluntly put, you can generate the best headlines ever, but if your opponent keeps scoring on you like this, you’re not going to win.

So wither my humming in a different key? This recent HuffPo piece makes a good case that Michigan presages that the next phase of the campaign is going to be tougher for Clinton and better for Sanders. We’ve all been noticing all along how lopsided her Southern victories have been. This got me mathematically curious, So I re-ran my totals from last week, honing in on the difference between Southern results and everywhere else. Overall, Clinton/Sanders are at 60/40 for vote totals so far, but if you break it down from there, it looks a bit different:

southern

The significant thing about this is, Clinton is almost out of Southern states. North Carolina and Florida are the only ones left. so one could make a not ridiculous argument that Sanders might win a majority of votes and delegates for the remainder of this race after Super Tuesday 3. Ultimately, though, that doesn’t change the math. Right now, excluding Superdelegates, we’re at:

math

If Sanders performs at the average of his non-Southern state totals for the remaining contests, he would still be under pace for the total of remaining delegates that he needs to win. Clinton would too, but not by as much, and the big wins she’s likely to get in Florida and North Carolina tomorrow will Probably bring it in range- she’ll need mid to high 40s percentage of remaining delegates, and she can be expected to average mid to high 40s percentage of remaining votes.

Sanders, meanwhile, based on where he’s done well so far, will probably win Missouri, and be quite competitive in Ohio and Illinois, maybe even score a narrow victory in one of them. I don’t think this changes the ultimate trajectory, but he now has every chance of remaining in the race, and strongly so, for the duration.

Republicans

The big story here is the winner-take-all contests in Florida and Ohio. Unlike the Democrats, who generally reward delegates proportional to vote most everywhere, the Republicans have many states where the highest placing candidate gets all the delegates. In this case, interestingly, it intersects with the home states of two of the remaining candidates, Marco Rubio and John Kasich.  Unfortunately for Rubio, all signs are that this won’t work out for him:

florida

Kasich, meanwhile, seems to have a pretty decent shot of taking his home state, and all of its delegates:

Ohio

All of this is quite volatile. You can make a good case that, notwithstanding what happens in Florida and Ohio, Trump could do well enough in the other states to effectively put the whole thing away. On the other hand, you could also make the case that Cruz is close enough that, if Super Tuesday 3 ends up knocking out both Kasich and Rubio, he could still win a one-on-one with Trump. We could also have a case where, by virtue of winning Ohio while Rubio loses Florida and places badly elsewhere, Kasich becomes the surviving establishment candidate, holding down a roughly equal percentage of votes to Cruz going forward, and keeping all three of them below the threshold before the convention.

This is where the numbers stand at the moment:

math2

Where they are at this point next week will be fascinating to see!