
You have perhaps been seeing stories about how Republican enthusiasm is surging, and the Blue Wave is dead. Or that early voting numbers show that the Kavanaugh effect has hyper-charged Republicans, wiping out everything that has happened over the last two years on the Blue side. I have two things to say about this, in general:
- Always be suspicious of anything in the closing weeks of a campaign implying everything is hosed and you might as well just give up.
- Be suspicious of narratives that aren’t properly informed by data.
To get more specific, let’s follow up on number two for a minute. If we look at a few quantitative indicators, what do they tell us? Specifically, let’s look at a period of time covering September 26th (the day before the Ford/Kavanaugh testimony to Congress) to today. If there is any lasting Kavanaugh effect, we should see its whole life cycle there.
The Generic Congressional Ballot
This is one of the most reliable indicators of what direction a Congressional election will go. I’m taking these number’s from 538’s tracker, which at any given time is informed by averages of a dozen or more recent polls from a variety of pollsters. On September 26th, before the whole denouement of the Kavanaugh hearings began, Democrats had an 8.6% edge in the Generic Congressional ballot:

Today, nearly a month later, they have… An 8.6% edge in the Generic Congressional Ballot:

On this basis, you wouldn’t say that Democrats prospects in the midterms have changed at all in the past month.
House Forecast Model
538’s House Forecast model has so much going on that it’s well-worth digging in to in detail. But let’s stick to some toplines. Before the final Kavanaugh testimony and vote, 538 thought Democrats had an 80% chance of flipping the House, and an average end result of a 232-203 edge:

Now, nearly a month later, the model thinks that Democrats have an almost 86% chance of flipping the House, and an average outcome of 235-200:
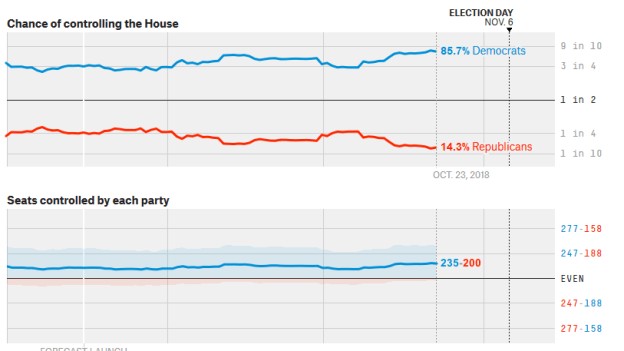
You could make a case that their prospects have improved, but rather marginally. The fundamental picture today doesn’t look that much different than it did a month ago.
Senate Forecast Model
This is probably your best exhibit to make the case “the Kavanaugh hearings really $$#^ed up the Democrats”. On September 26th, 538’s Senate Model had a 32% chance that the Democrats would flip the Senate:
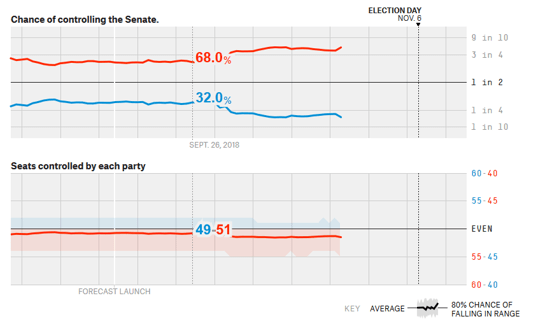
And now that chance is down to around 19%:
 That is certainly worse, but I think some perspective is in order. A roughly 1 in 3 chance was never a good chance, it was just not a pipe dream. A roughly 1 in 5 chance is not a very high chance, but it reflects deterioration in an already weak position, not some fundamental sea change in prospects.
I’d also point out that the average outcome, 52-48, puts us right back where we were before Doug Jones’ special election last year. This is still, historically, a very close Senate, and is oceans away from where many Republicans were expecting/hoping to be two years ago, when they thought 2018 might have them on the edge of a supermajority that would lock Democrats out for a decade. Instead, the current range looks like this:

50-50, 51-49, and 52-48 are the three most likely outcomes, and any of these put the Democratic Party in position to capture a majority in 2020, when the ratio of seats Republicans have to defend to ones Democrats do is as bad for Republicans as the 2018 map was supposed to be for Democrats.
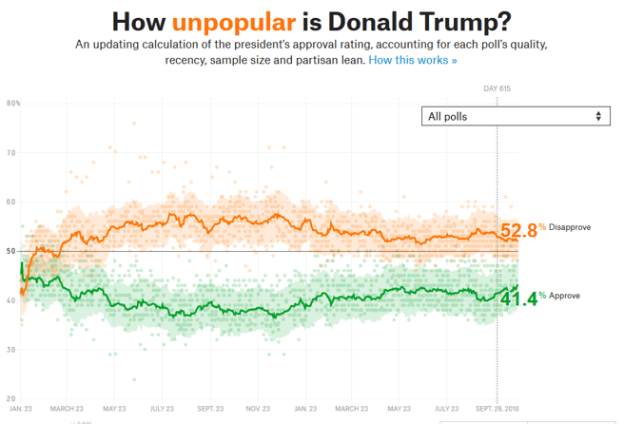
Trump Approval Rating
This could be another exhibit in favor of the “Democrats are worse off after Kavanaugh” theory. On 9/26, 538’s tracker for Trump’s Approval Rating had him underwater by 11.4%:
As of today, he has 8.9% net disapproval:
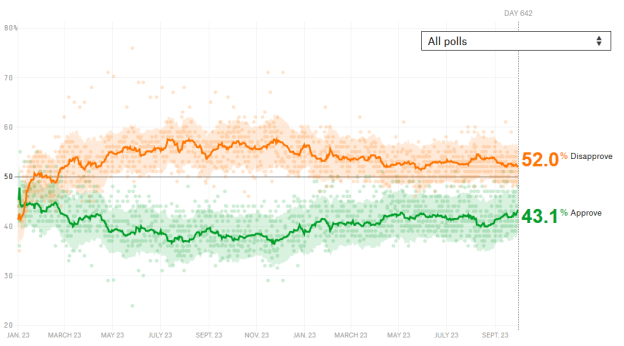
That is a pretty big turnaround, and represents some of his best net numbers ever. You could certainly attribute this to a shrinking enthusiasm gap. However, it’s worth noting that this “best ever” rating leaves him fourth from the bottom of all post-war President’s net approval ratings on the eve of a midterm:

While the correlation is not as strong as some people tend to think, this kind of net favorability is definitely historically correlated with the incumbent President’s party suffering major midterm losses.
State Races
One final footnote regarding the “Give up all hope! Democrats are totally hosed!” scaremongering you may see in the next two weeks is that there are whole other levels of government beyond the Federal level. Currently, there are 33 Republican governors to 16 Democratic ones (with one independent). 538’s Governor’s Model expects this to be something more like 26-24 after the midterms.
On the state legislature side (aka where most of the laws that most directly affect people are actually made), Democrats experienced a net loss of 1,000 seats over Obama’s two terms, with the result that 66 of 99 state legislative bodies are now Republican dominated. In special elections in the past two years, Democrats have won open races 10:1, and have every chance of flipping hundreds of seats on 11/6. There’s no single fancy model tracking this, but the prospects of Democrats flipping multiple state-houses are very strong.
A Final Caution
I intended this to be a kind of tonic to “the sky is falling” last-minute panic, which I know demoralizes some people. I have multiple friends, though, who will caution on the other side against overconfidence leading to complacency. They are right. If we want a big change on 11/6, we absolutely need to spend as much of the next two weeks as possible donating, dialing, knocking on doors, text-banking, post-carding- all the nuts and bolts that actually wins elections. The wave has only ever been us, and if we do it, it will happen. But we have to DO IT.
