Well, here we are, the Friday before the election. Almost made it, America! And, in contrast to how it might have seemed ten days ago, it’s looking like it could be a lively and interesting night on November 8th. We’ll check in on several of our standard indicators, but really at this point it’s all about margins and momentum. So let’s take a look at that.
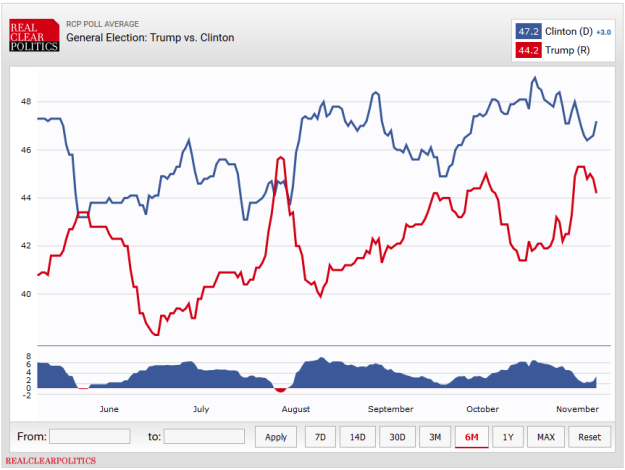
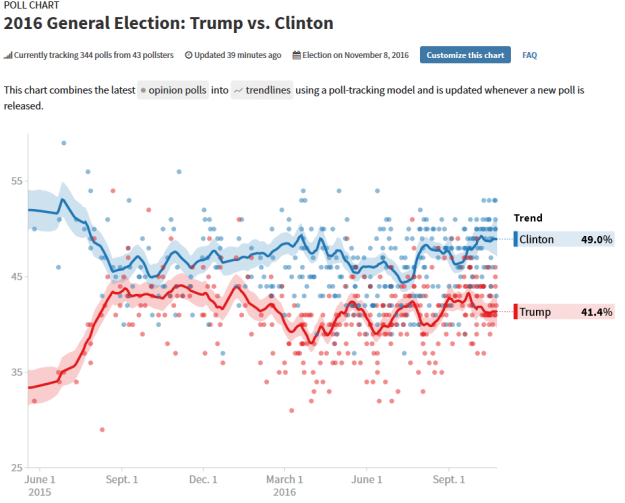
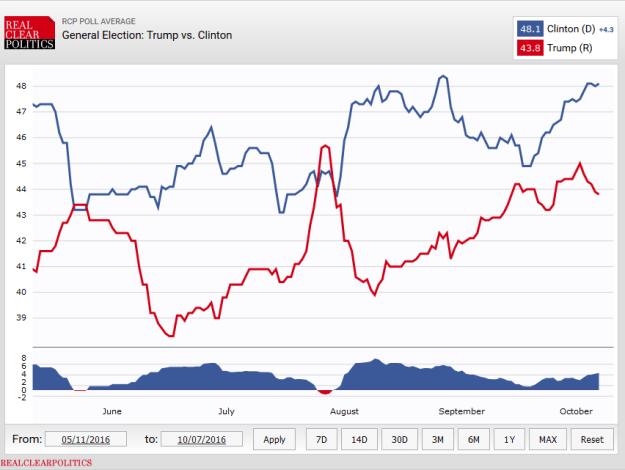
First, let’s look at the movement in three leading poll aggregators over the last week. RCP is the most “conservative”, in the sense that it takes a small set of polls, and only does a straight mathematical average. HuffPost is the most “liberal” in the sense that it includes almost all polls, and then does regression adjustments on them. 538.com is a data-rich medium, which includes a wider array of polls than RCP, but more selectively than HuffPost, and weights them according to historical accuracy of the pollster, and makes adjustments for historical partisan bias of various pollsters. These three averages include some of the same data across them, some different, and treat it in three different ways. If we average them all, we get:

There are a couple of things to note here. First, Trump has definitely gained over the last week, but he hasn’t done so at the expense of Clinton, who’s average all-in is unchanged. The most likely explanation is that Republican-leaning voters who had been on board with Johnson or undecided are now coming home to the Republican party in the wake of the latest FBI kerfluffle. Second, Clinton’s lead is probably outside a margin of error of roughly 3%, albeit narrowly.
What if we assume the same thing happens over the next four days that did over the last week? That would leave Clinton unchanged at 47%, and gain Trump another 1.7% to bring him to 45%. At this point, assuming current Johnson+Stein polling of around 6% is right, that would leave just 2% undecided. Looking at the makeup of the current undecided/uncertain vote, there’s no clear indication of a decisive break toward either Clinton or Trump. This is kind of a Trump “best case” (all remaining movement is toward him, and he gets a 50-50 split of undecideds), and it still ends up with Clinton-Trump 48%-46%.
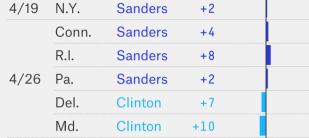
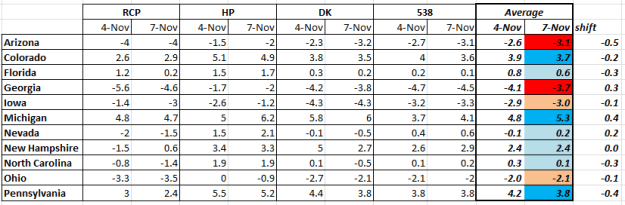
The rub, of course, is that the popular vote doesn’t determine who becomes President. The Electoral College does. Looking again at our above three poll averagers, and adding in DailyKos, who doesn’t do a national polling average but does track individual states, we see the following movement in what are commonly considered “swing states”over the past week. Since it’s a lot of data, I’m just listing the margin between the two candidates (+ for favoring Clinton, – for favoring Trump):

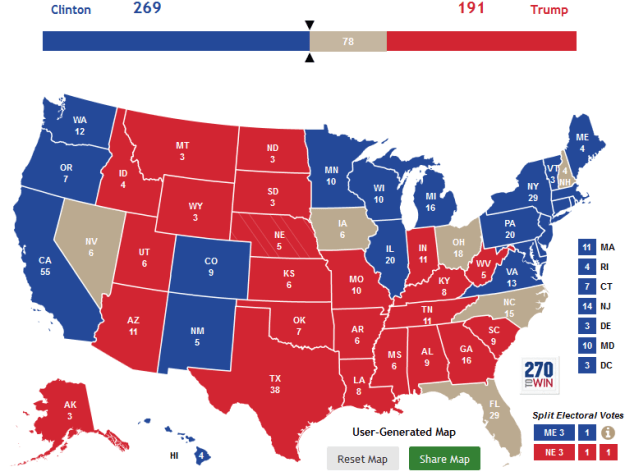
The same shift toward Trump in National margin is apparent in every state, sometimes to a greater extent, sometimes less. The other thing that you immediately notice is that some of these aren’t really swing states at all. Colorado and Pennsylvania have Clinton margins outside the margin of error, and remain in her column even if Trump makes further gains over the next 4 days equal to what he did the past week. Similarly, Georgia has a Trump margin that’s unlikely to go anywhere. Adding these to the “safe” map for each candidate, you get the following:

You could look at this map, in conjunction with the state numbers above, in two ways:
- This is a pretty good map for Clinton. Even with further shifts against her, she probably has 269 electoral votes, and Trump can only win if he takes all 7 swing states, and peels off one of the electoral votes in Maine (one of two states that splits its electoral votes). Clinton currently has leads in three of them, and Nevada is 50-50.
- This is an extremely borderline map for Clinton. She still has leads in New Hampshire, North Carolina, and Florida , but if the next four days see further movement for Trump equal to the last week, all these leads could go away.
So, in other words, Clinton very likely is headed toward a popular vote win. But even if she’s ahead nationally, the following three electoral college maps are all plausible (I’m splitting Maine in one of them, but not fiddling with the outside chance that McMullin takes Utah, which is an additional wildcard):


I would advise looking carefully at the updated state averages on Monday (I may publish an update Monday if I have time, but my schedule is looking dicey). In the meantime, let’s take a look at what various sources are saying. Because saying that all three outcomes are possible (or even a larger Clinton blowout, or Clinton collapse) is not the same as saying that they’re all equally likely, and your best bet is still look at an array of indicators.
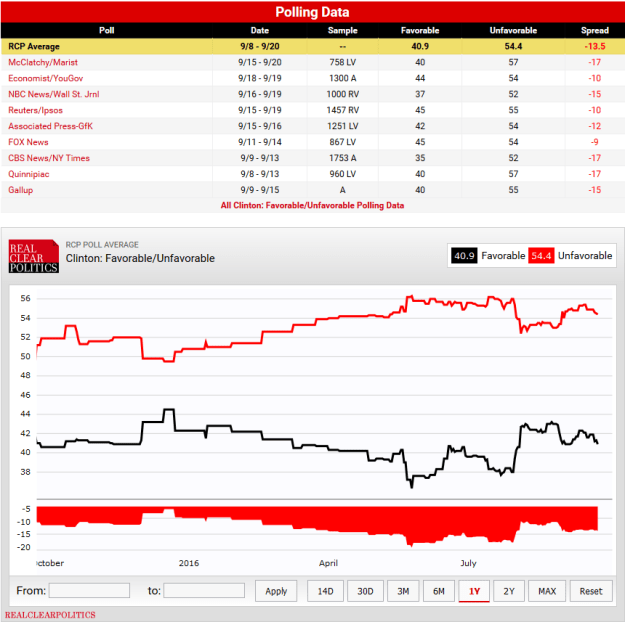
Even after the FBI scare, Clinton still has about a 6 point edge in lower net unfavorability compared to Trump:
The RCP “No Toss Ups” Map shows the following:

The DailyKos forecast model has this:
HuffPost’s model shows the following:
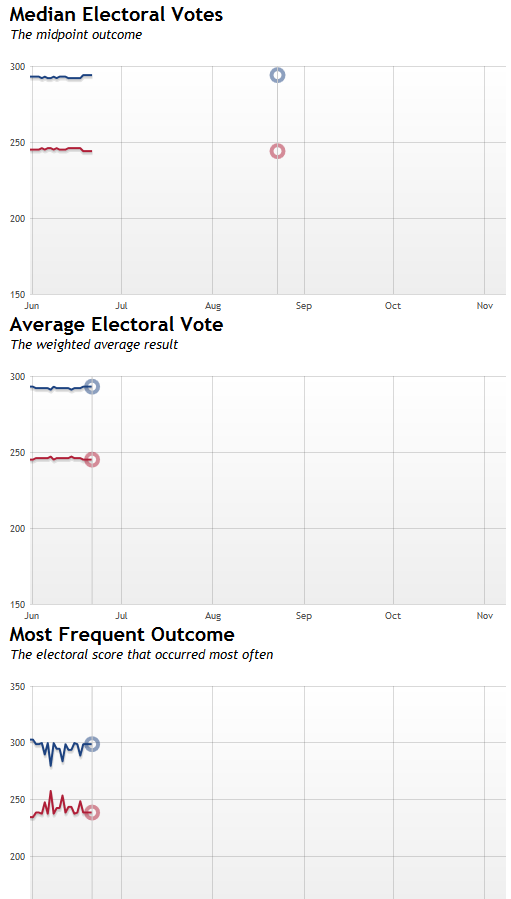
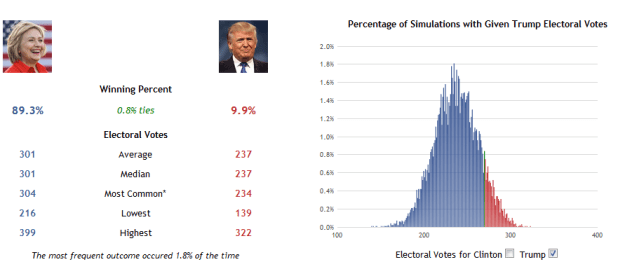
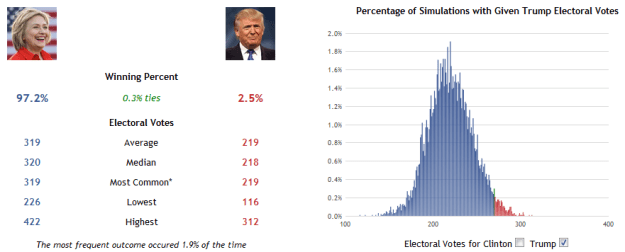
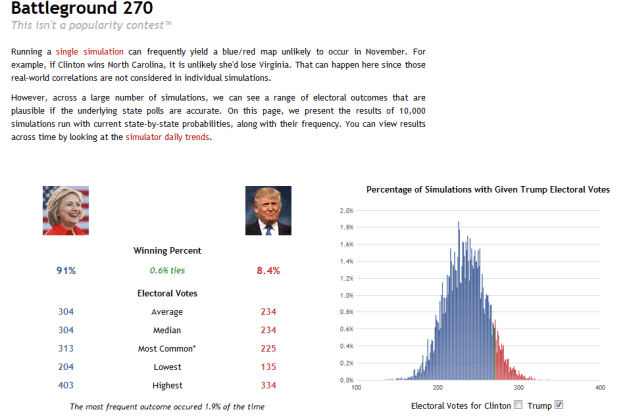
270towin.com’s 10,000 simulations a night are returning the following averages:
And 538.com is currently showing:
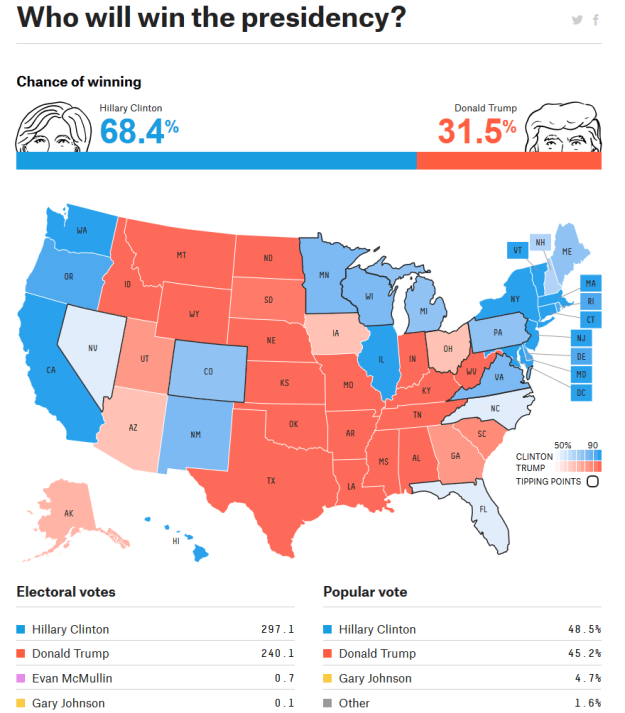
Note that 538 shows a much lower confidence level than the others. What this essentially boils down to is a difference not over what the polls are saying, but how likely it is that the polls themselves are wrong. 538.com builds into its model a higher chance that, although state totals indicate a Clinton victory, there could be a polling error of a magnitude such that the polls are wrong. Not a 100% chance, but not zero either, thus they end up around 70/30 instead of the 90%+ that the others are at.
The aggregated betting markets at Predictwise.com are somewhere in-between these two levels:

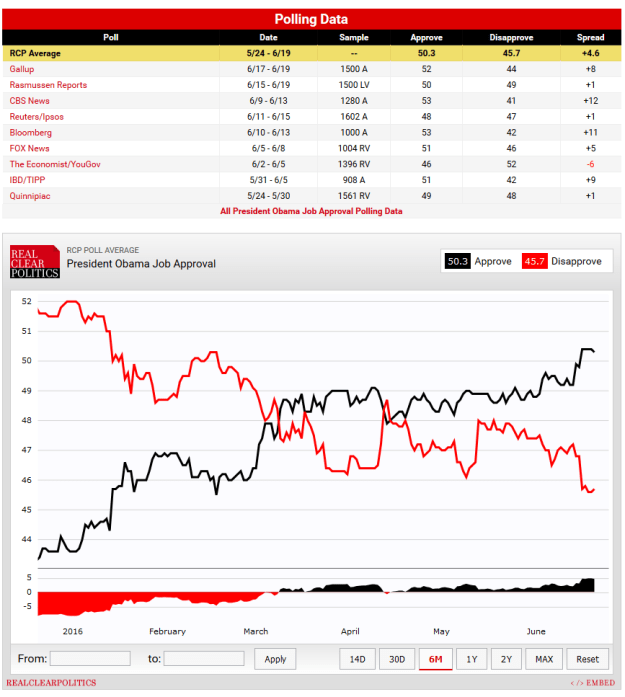
And, finally, President Obama’s approval rating remains at a level that could indicate Democratic victory:

With less than four days to go, based on the preponderance of all available indicators, Hillary Clinton is quite likely to be elected the next President of the Untied States on Tuesday. There is one final relevant indicator: You.
GET OUT AND VOTE!


 They also have a “polls-plus” version that includes what you would expect for the incumbent party based on economic performance in the mix. As election day approaches, the two converge, since it’s assumed this is increasingly “priced in” to the polls. This model remains a little more conservative than “polls-only”, and it is showing the following: