

Well here we are, with 60 days to go! That frightening image above, by the way, is the “Red Mirage”. We’ll get back to that later. But first, as a reminder, at three months to go, we concluded that things had tightened a little since four months out, but that Biden remained in a very solid position. How do things look now that we’re two months out?
The last thirty days have seen a lot of news:
- Biden’s VP pick of Kamala Harris
- Both party’s conventions
- Trump taking action on a series of executive orders meant to address the economic fallout from the pandemic
- New national unrest, including murder of protesters, over the police shooting of Jacob Blake in Kenosha, Wisconsin
- Trump responding by a full-court press to run a “law and order” campaign
In response to all this activity, national polling over the past month has seen…on net, just about nothing. Biden is up 0.2% over a month ago, and Trump is up 0.4%, leading to a net of Biden +7.2% now vs. Biden +7.4% a month ago:

Yes, but the polls in 2016 were wr- Stop! Stop? Stop. It is, however, useful to compare Biden’s year-to-date position in the RCP average to Clinton’s 2016 average for the same period:


One will note that Biden has been above 50% several times. Clinton only ever was for a single day. Biden has almost never been below 48%. Clinton was rarely above 48%. Biden has never had a lead of less than 4%. Clinton was less than 2% multiple times, and Trump was even ahead of her twice. On this same day in 2016, 11% of voters were undecided between Trump and Clinton. Only 8% of voters are between Biden and Trump. Everything about the comparative perspective says that Biden is and consistently has been in a much stronger position than Clinton.
It is worthwhile to note that RCP’s polling average is “naive” in the sense that it just averages all major polls within a certain time period (the last eight days, at the moment). 538’s polling average is a bit more sophisticated as it weights pollsters according to their historical track record of accuracy, and makes adjustments for pollsters that show consistent partisan lean in one direction or the other. Using this methodology, 538 currently has Biden at +7.3% vs. +8.2% a month ago:

In 2016, Clinton won the popular vote by +2.1%. Taking the smaller of the two averages above, Biden at +7.2%, and adding that difference of 5.1% to Clinton’s 2016 state by state margins results in the following electoral map:

That gives us a ballpark of how things might be different this time, but of course state by state dynamics are not necessarily going to be the same as last time. If you look at RCP’s averages of the likely swing states, Biden currently leads in all of them:

This has narrowed within the last 30 days, which is certainly worth keeping an eye on:

However, it should be noted again that Biden maintains a fairly strong and consistent lead in these states. Using its more robust methodology, 538 is currently showing:
- Wisconsin Biden +7.1%
- North Carolina Biden +1.8%
- Florida Biden +4.1%
- Pennsylvania Biden +3.4%
- Michigan Biden +6.4%
- Arizona Biden +4.6%
If we took only those states where Biden has more than a 5% lead according to the 538 averages, we would have this map:

Under this map, if Biden wins any one of Florida, North Carolina, or Pennsylvania, even by a few hundred votes, he’s President. Trump would have to win all three to prevail. If Biden just won Arizona, we’d be at 269-269 and the election would got to the House. May Al’lah forefend against such an outcome.
For their part, RCP’s current “no toss-ups” map shows the following:

There are some other electoral data points worth considering as well. RCP’s “no toss-ups” Senate map currently has Democrats picking up five Senate seats (and losing Alabama) for a net gain of +4, which would flip the Senate:

And the Generic House Preference polling has Democrats up by 7.3%, not far off of the 8.7% that catapulted them to a net gain of 41 seats in the 2018 midterms.

Finally, there are Presidential approval numbers to consider. Trump is currently underwater by nearly 9%:
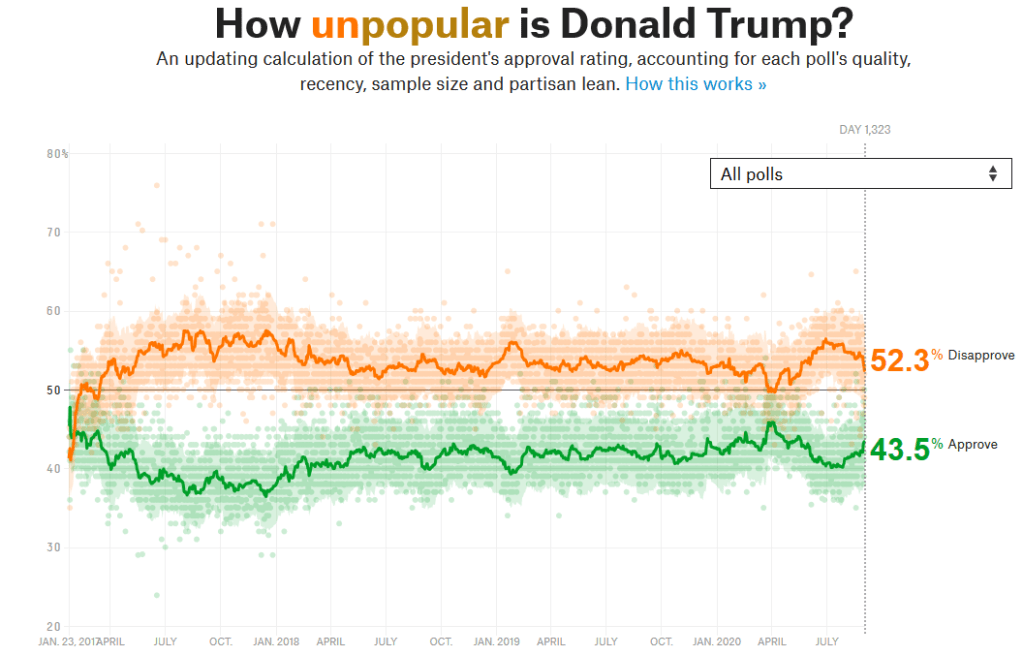
While that’s actually an improvement from nearly -14% a month ago, on the face of it you might still think this isn’t a good place for an incumbent to be two months out from an election. And you would be right! The only two first term Presidents of the last 50+ years who have been in a similar position were Carter and Bush I, who were both headed for defeat:

What this all boils down to is that national polls, state-by-state electoral college totals, the outlook for House and Senate races, and Presidential approval ratings are all telling us the same thing: Biden remains in a very strong position with two months to go.
Now, a word about our opening graphic. This is what’s being called the “Red Mirage“. Indications are that a large percentage of Biden-leaning voters are planning on voting absentee. A similarly large percentage of Trump-leaning voters are mail voting-averse, and are planning on voting in person. Meanwhile, the individual states have widely varying rules about when absentee ballots must be received by, and the deadlines for starting and finishing counting them.
Because of all this, Election Night returns may show a big lead for Trump, and Biden’s true numbers won’t be apparent until several days, maybe even more than a week, later. There is nothing improper or weird about this, and it doesn’t affect the final outcome at all. But the two dangers it presents are:
- If you don’t know it’s happening, Election Night could be pretty scary!
- It presents Trump with a week or more to agitate his followers about the “illegitimacy” of the outcome, something that could be enormously disruptive for the country.
So I would recommend fortifying yourself against the first possibility, and all of us being prepared to take appropriate action against the second. Meanwhile, we’ll reconvene in a month to see how things are looking with a month to go!
