Tag Archives: 2020 election

Four more years? (ONE DAY to go edition!)

Well, here we are. The final update!

When we did the very first one of these, with eighteen months to go, I was arguing against the then fashionable Democratic peeing of the pants that Trump was inevitably going to win and we were toast. At one year out, I said there was still every chance we could do this, even though we didn’t know who “we” would be yet. At 6.5 months to go, I said that Biden’s chances were good, and Trump was in serious trouble. And last week, with one week to go, I concluded that Biden remained in an extremely strong position.

Well now, with one day to go, it’s put up or shut up time. Looking at the evidence, I think it’s overwhelmingly likely that Biden will win tomorrow (even if the result isn’t certain for a few days to a few weeks). Let’s take the evidence piece by piece.

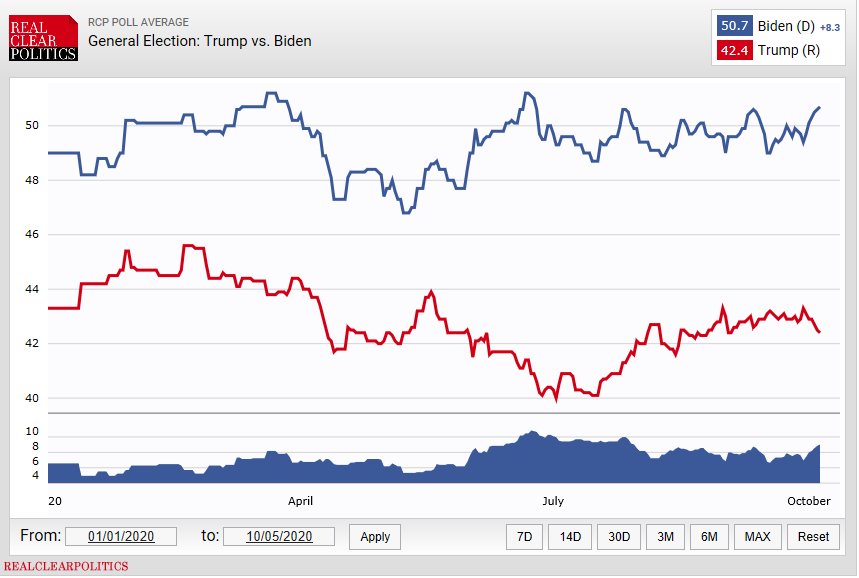
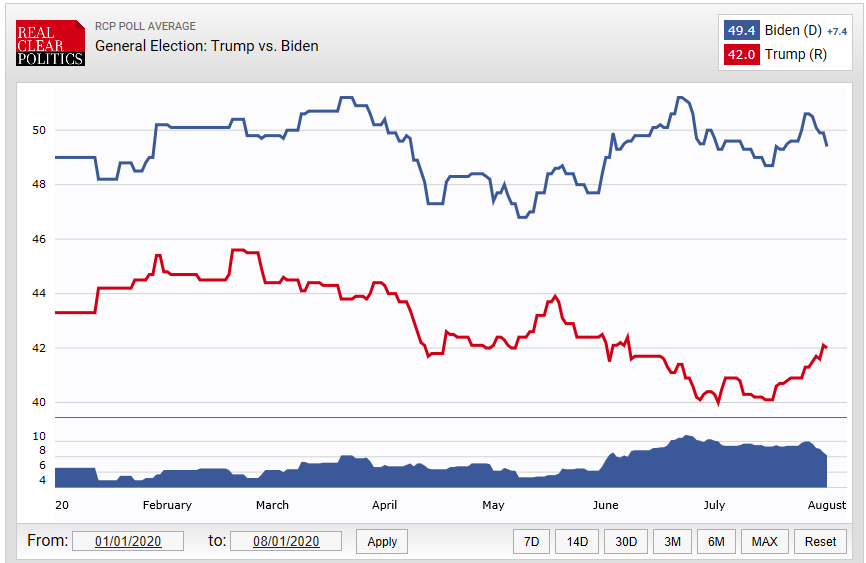
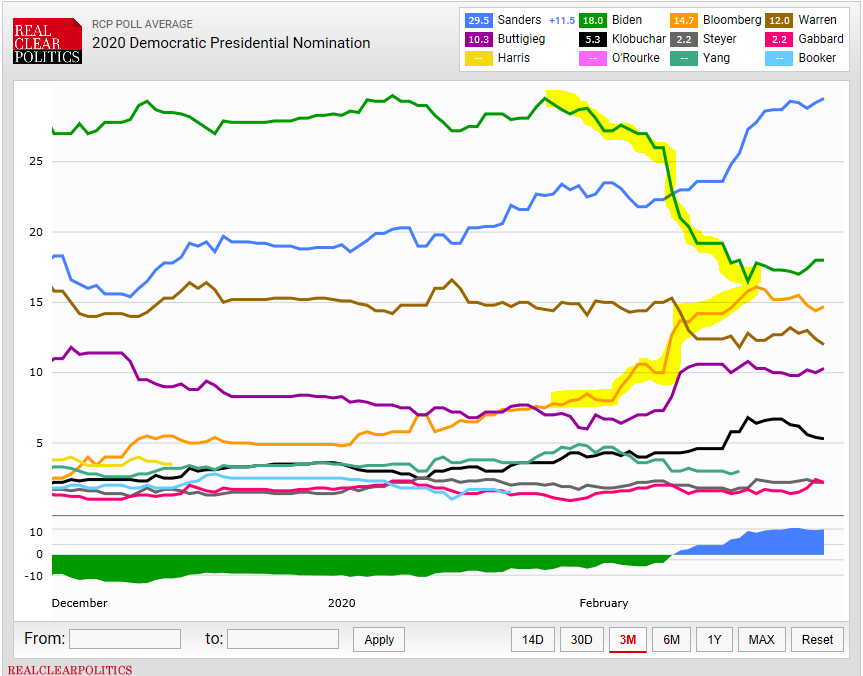
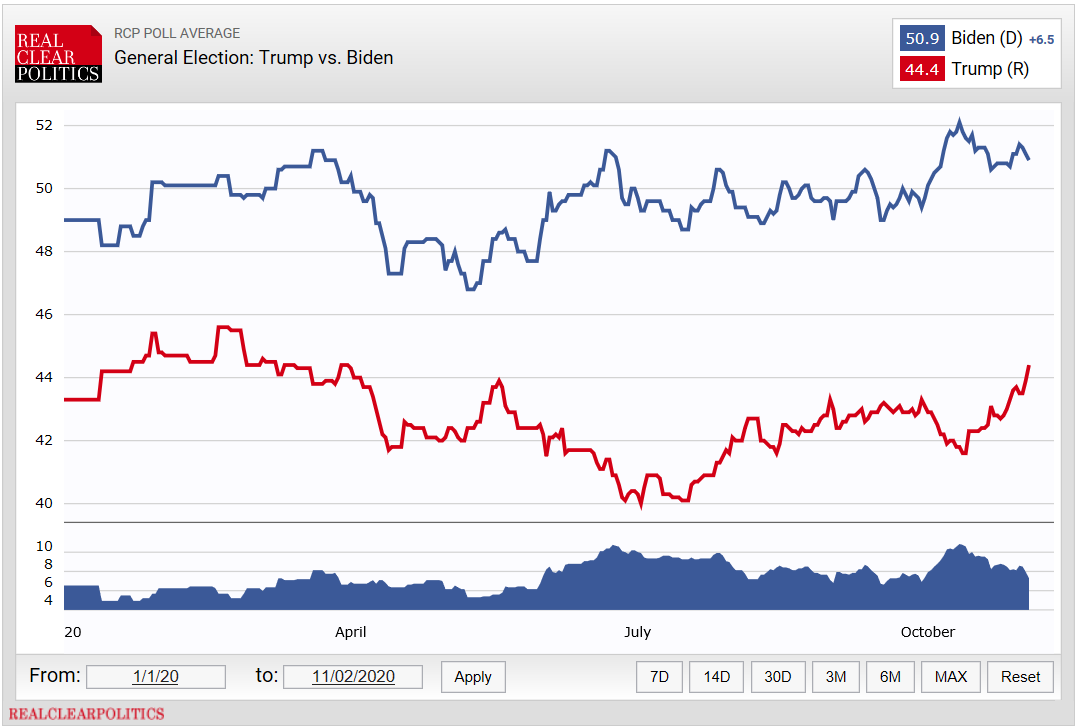
Since last week’s update, the RCP national average has tightened somewhat, from +7.4% Biden to +6.5%:

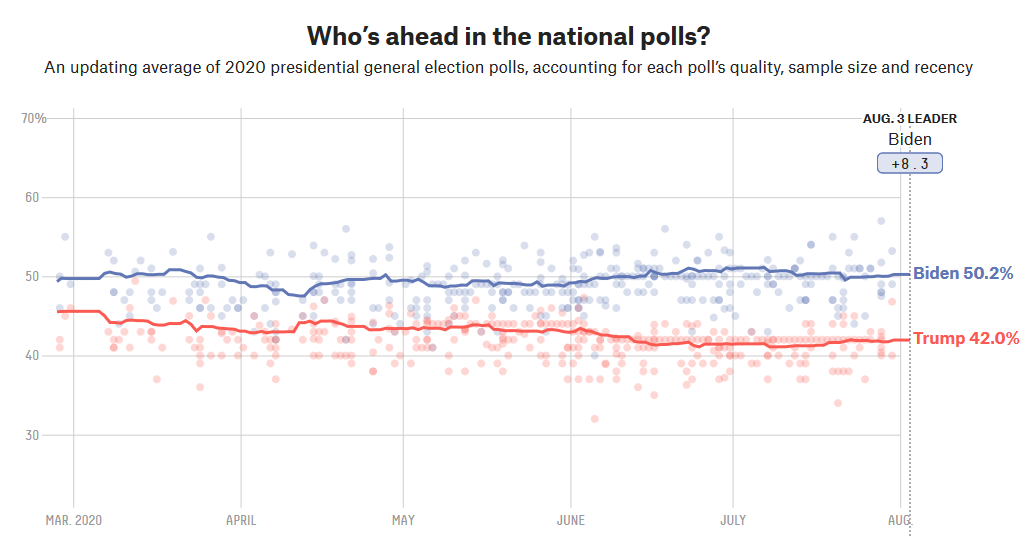
If that’s all it’s moved in 6 days, it’s not likely to suddenly change in 24 hours, and if Biden is ahead by more than 6% nationally, he probably wins, no matter what chicanery the GOP pulls at the state level. Don’t just take RCP’s word for it, though. The 538 average is much more sophisticated, as it takes into account the historical accuracy of various pollsters, and their typical partisan lean. It has Biden up by 8.4%, down slightly from 9.2% six days ago:

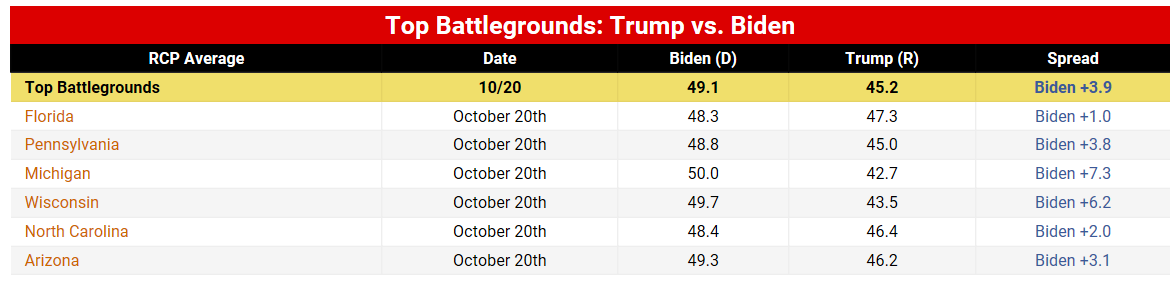
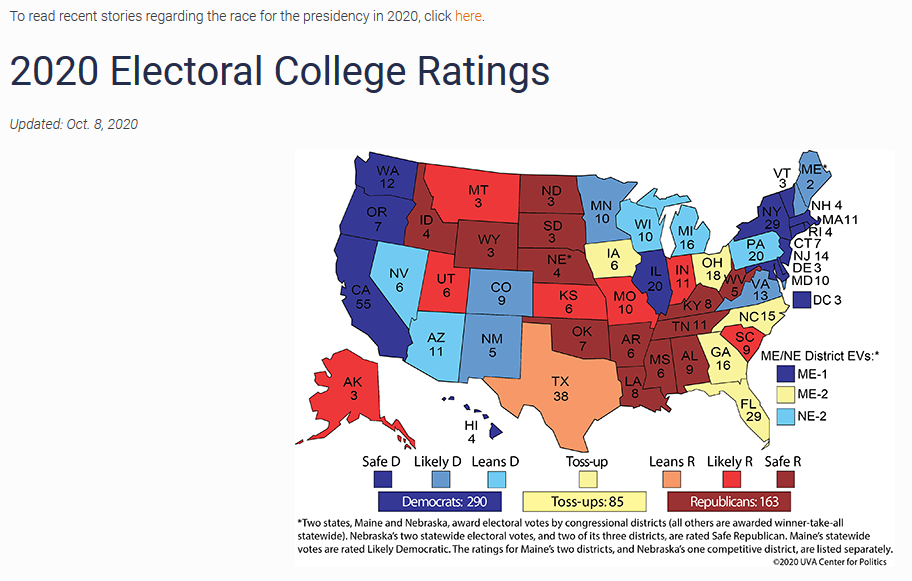
It is of course state totals and the resulting electoral college total that is the final determinant. National averages are useful in setting a ballpark for state results, but to really get a sense, we need to look at the most likely swing states.

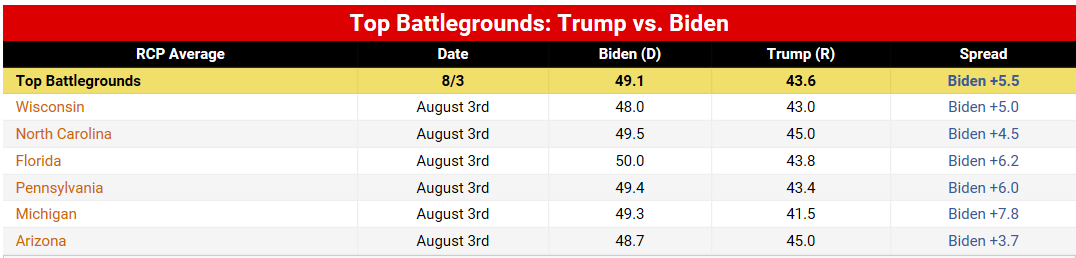
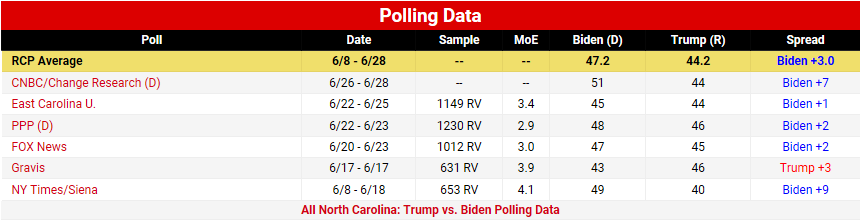
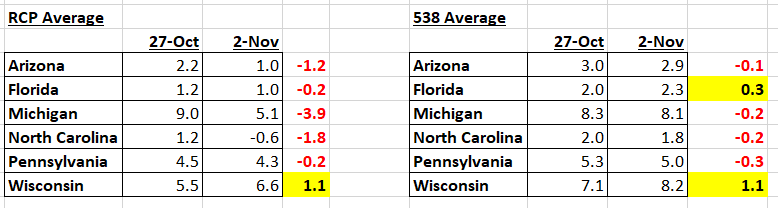
Last week, RCP had Biden ahead in 6 out of 6 swing states. It now shows him ahead in 5 out of 6, with some seeming movement towards Trump. However, RCP is also including some pollsters that have had a…questionable…habit of producing implausibly Republican-leaning numbers. 538, as mentioned, tries to adjust for things like this, and it shows Biden ahead in 6 of 6, and only Wisconsin having (pro-Biden) movement that’s outside of a tiny tick up or down that’s indistinguishable from statistical noise.

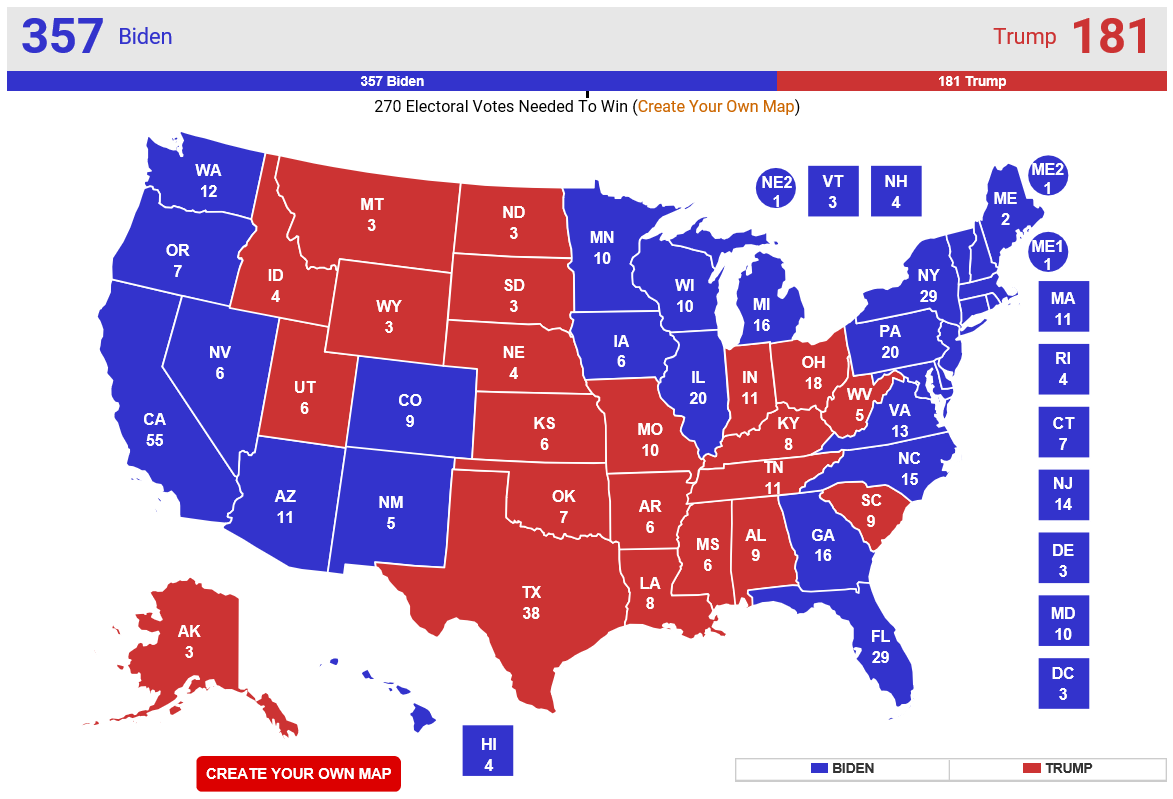
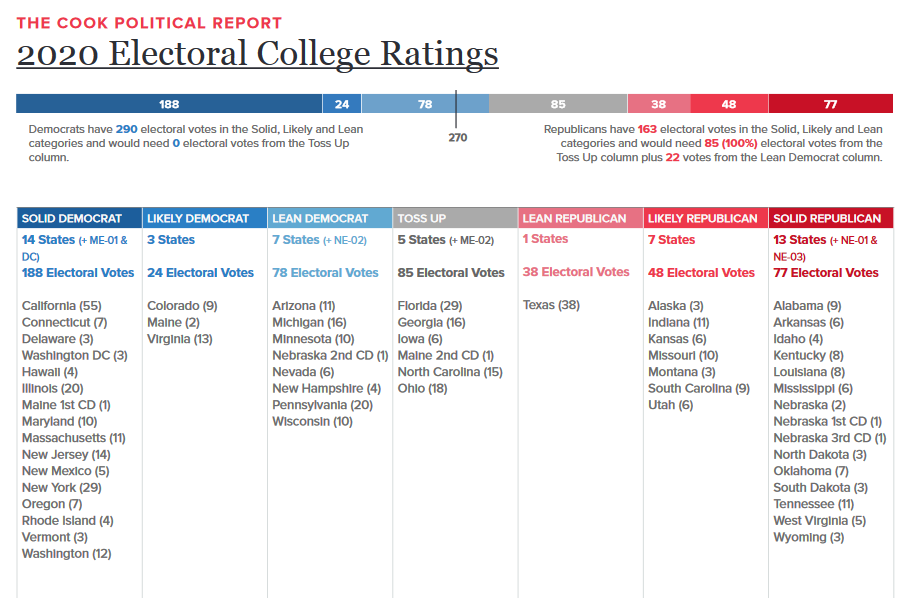
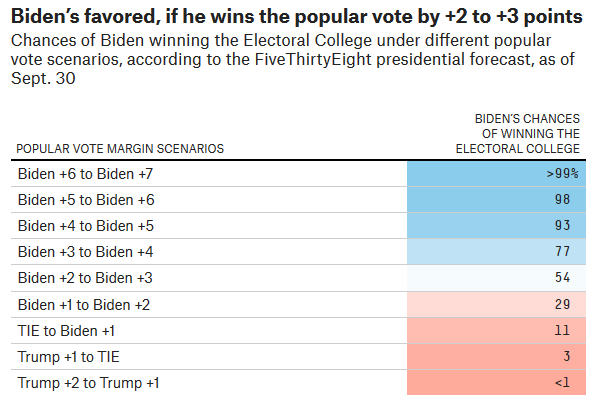
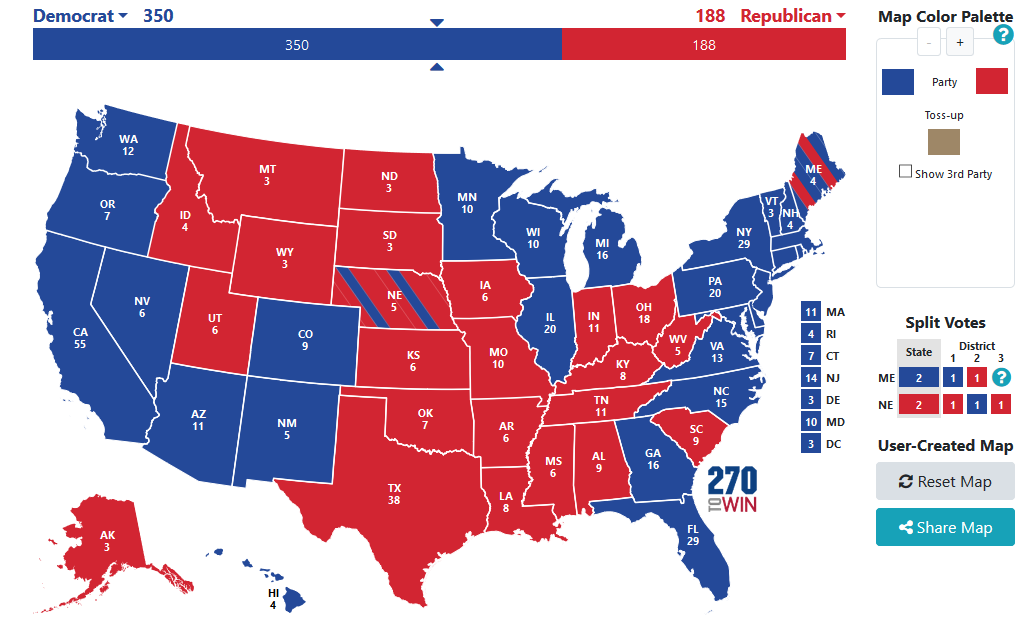
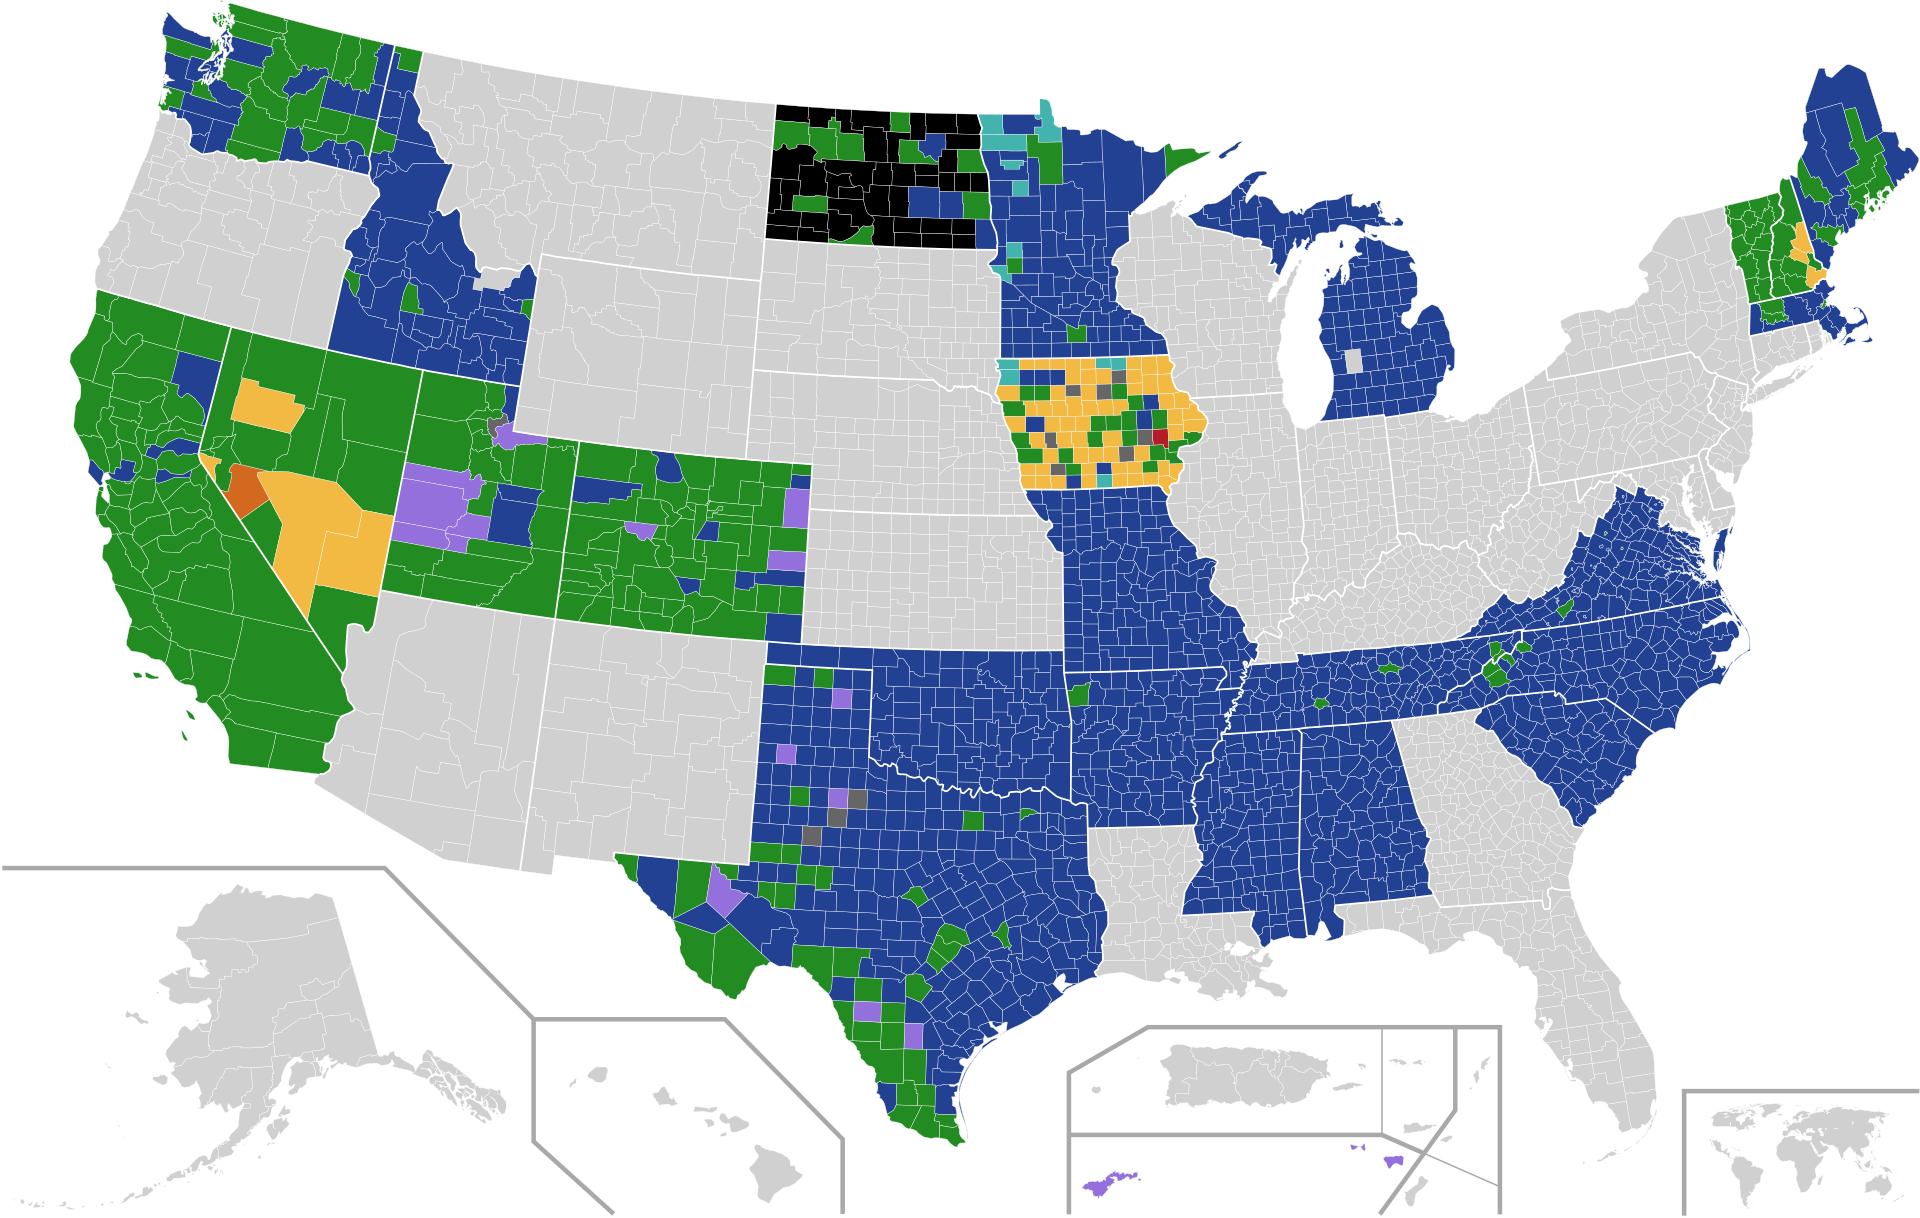
If one just takes the three states 538 has Biden ahead by more than a typical 3% margin of error and leaves everything else to Trump, this is the resulting map:

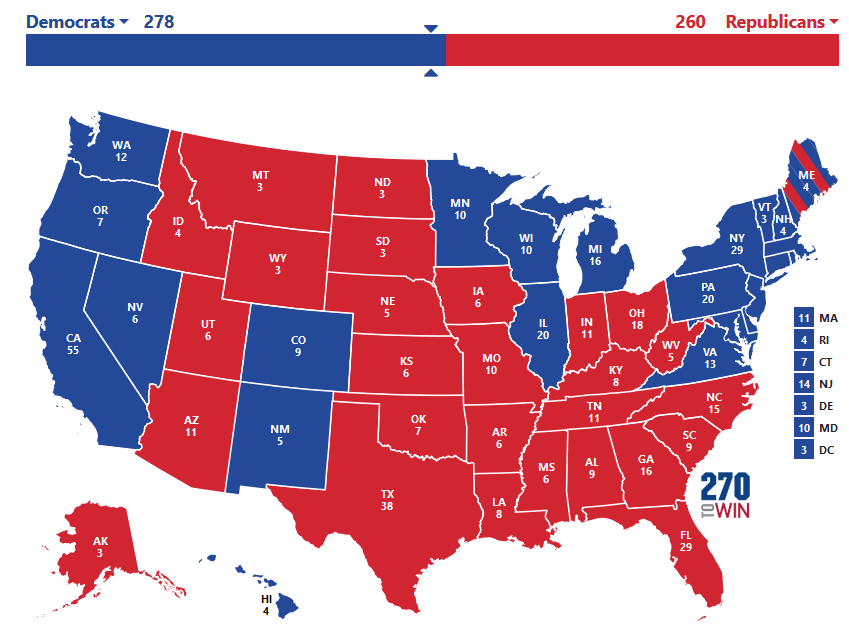
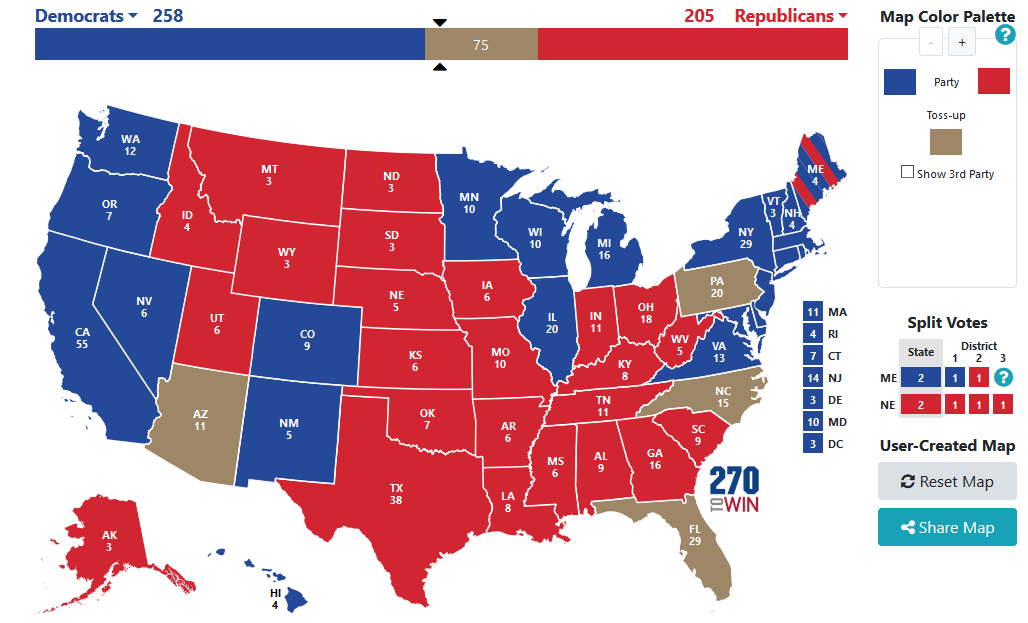
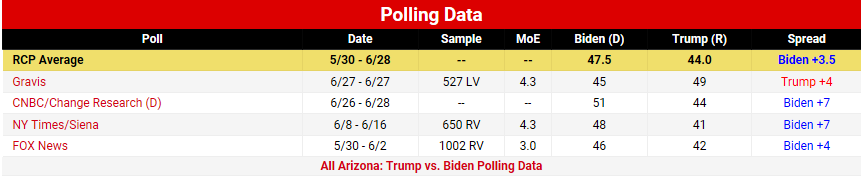
But, as mentioned, Biden also has leads in several of the other likeliest swing states, and in addition to those six, Georgia, Iowa, and Ohio are all widely thought to be in play. RCP’s “no toss-ups” map currently shows the following:

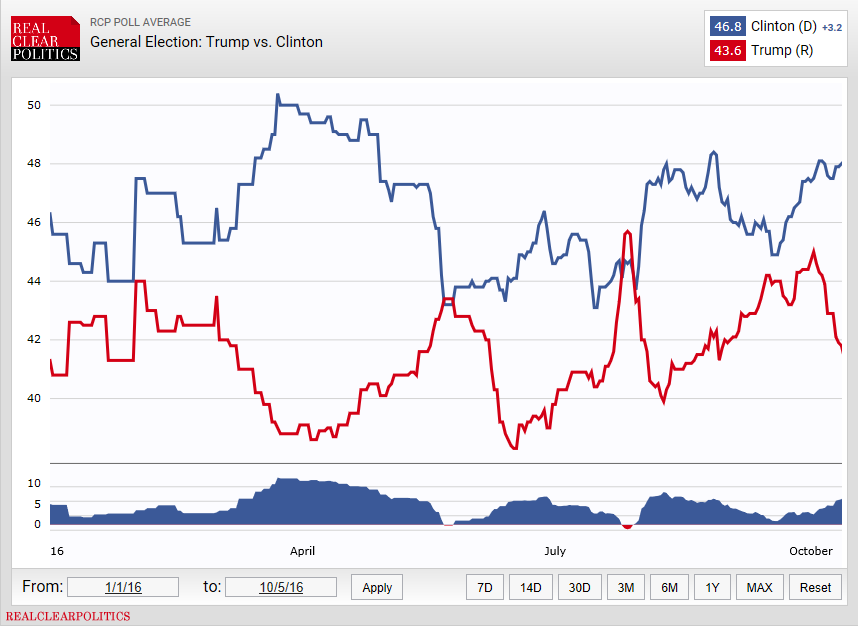
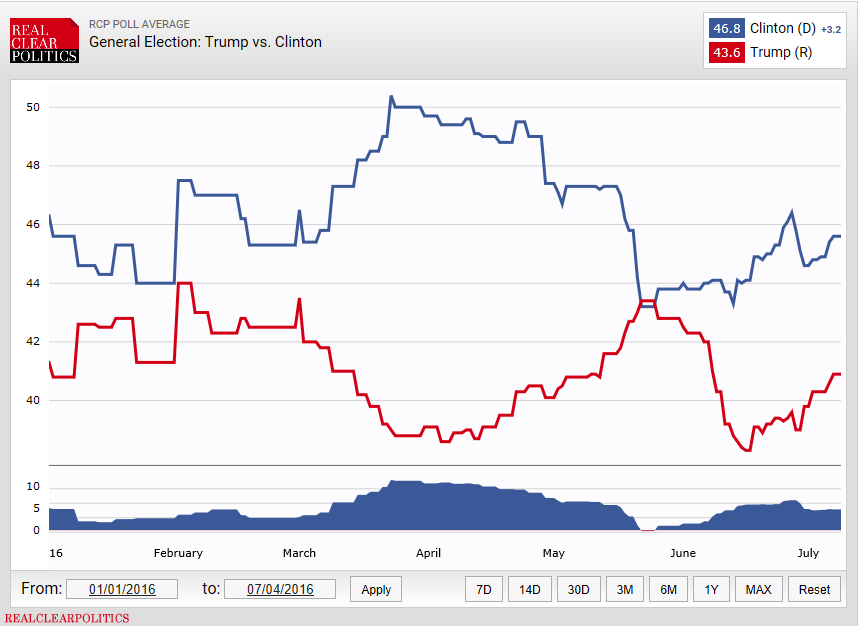
Taking one last look back at Biden’s position this year relative to Clinton’s in 2016 is also instructive:

To give a few highlights:

  • Biden’s lead is twice as large as Clinton’s at the same point.
  • On the eve of the 2016 election, 9.4% of voters were still undecided. Now, only 4.7% of voters are.
  • Biden is just shy of 51%. Clinton was below 47%.

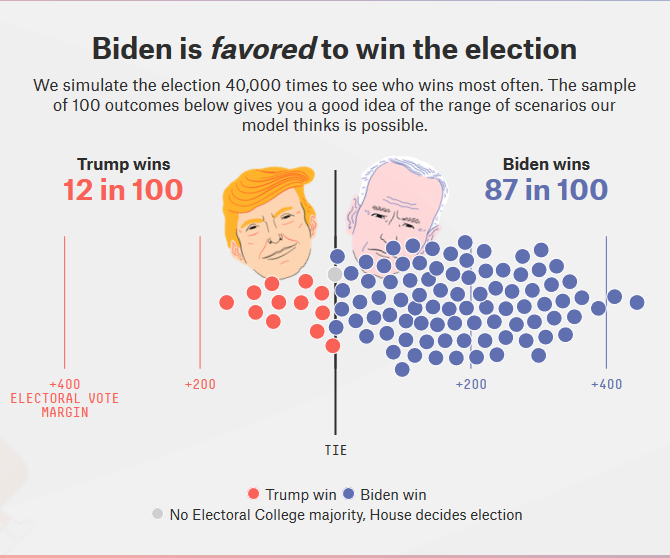
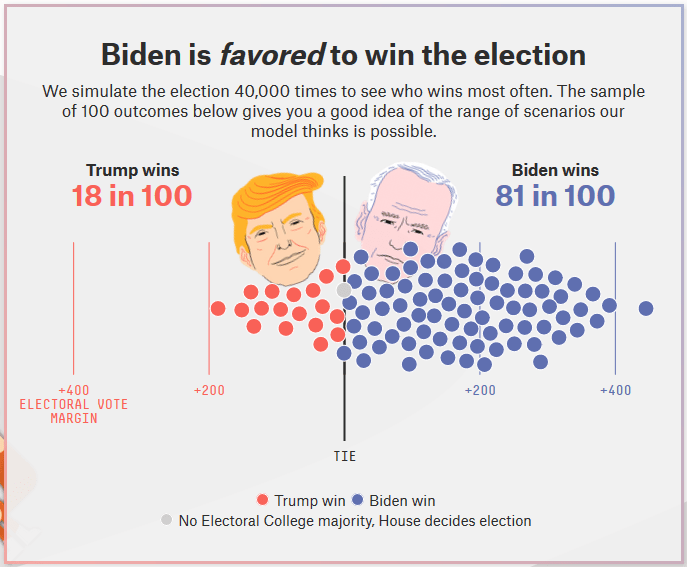
In short, all the factors that made it more likely Trump could edge ahead of Clinton are not in play this year. And, indeed, 538’s forecast model now has Biden with a 90% chance of winning:

At this same point, Clinton was around 70%:

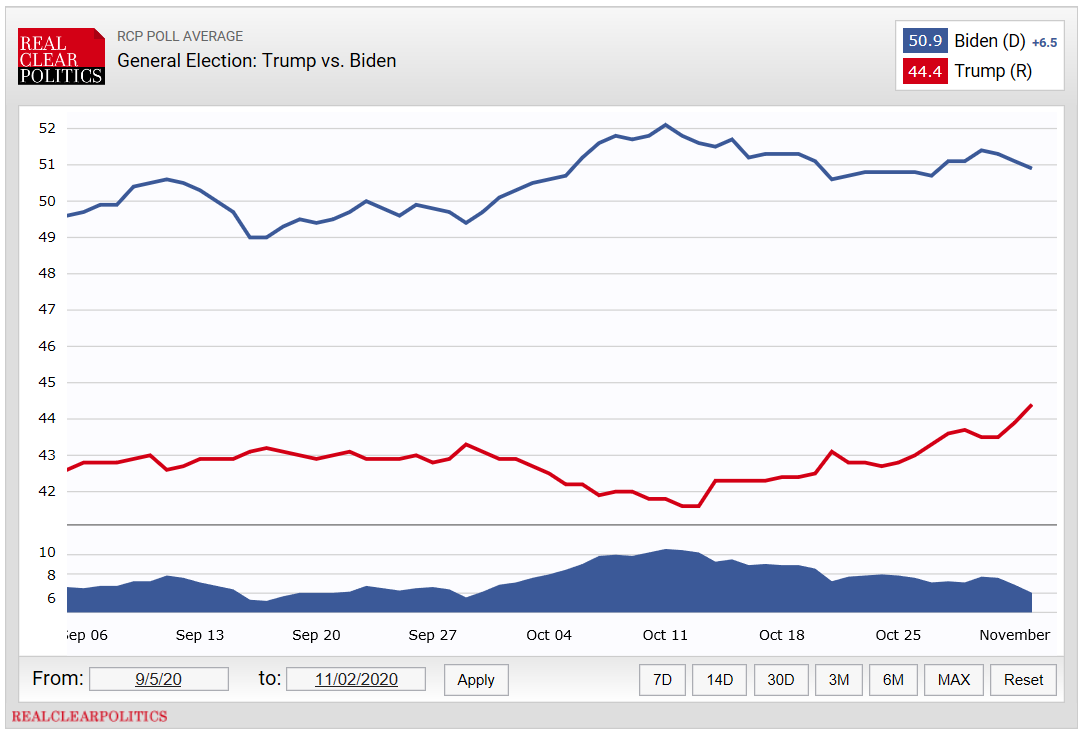
There’s a very important point to keep in mind about all the above polls as well. I mentioned this last week, but it bears repeating. These are not just leading indicators of how people may vote tomorrow. They’re also what people were saying as they were actually voting. As of this writing, early voting equals just shy of 70% of 2016 total votes:

The earliest votes started on 9/5, when North Carolina sent out its absentee ballots. Which means the above 70% of the 2016 vote all came in during a period in which Biden was never leading by less than 5.8%, and was frequently up by as much as 8% to 9%:

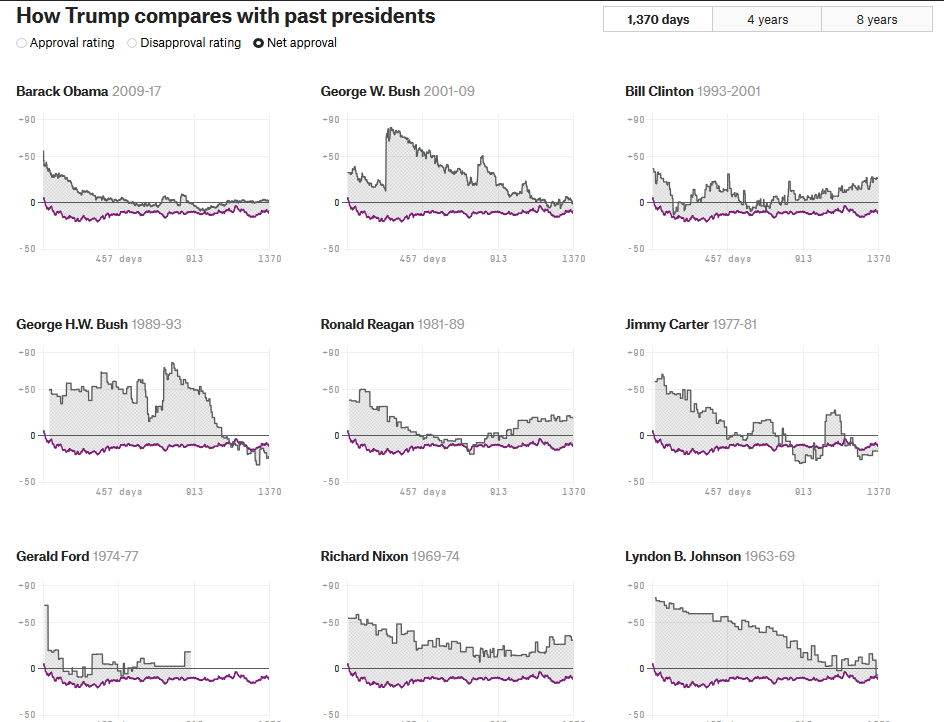
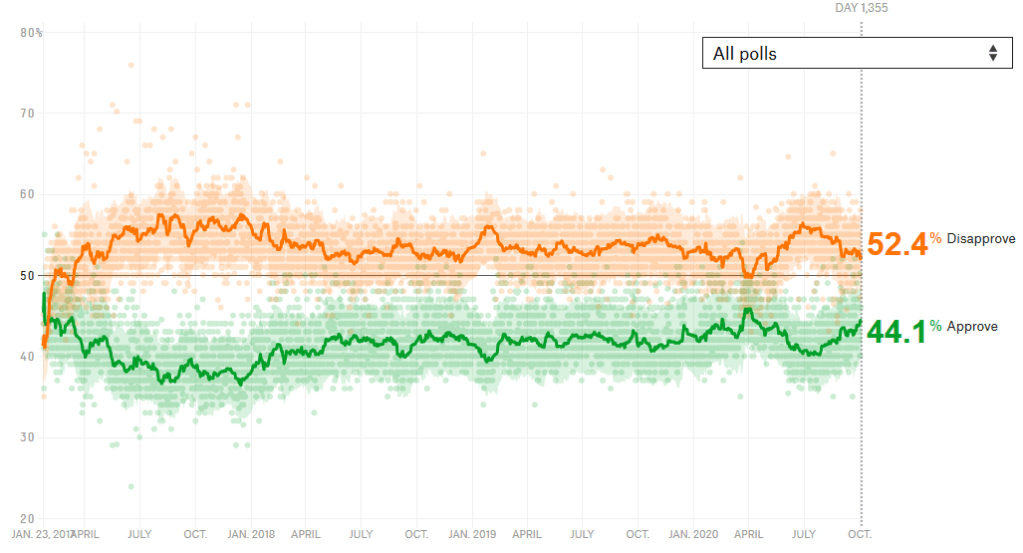
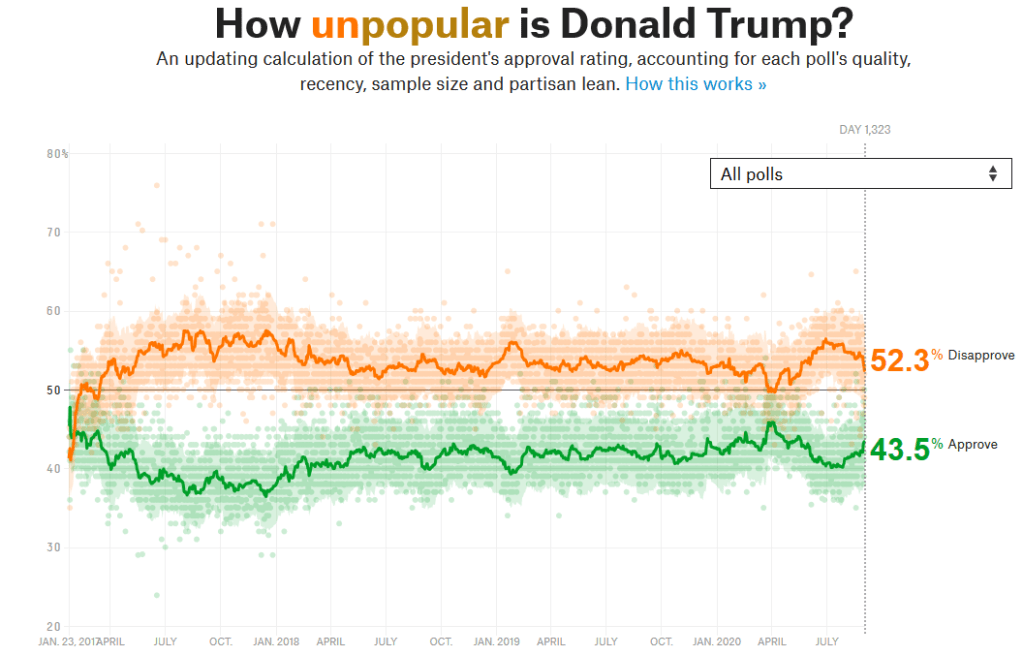
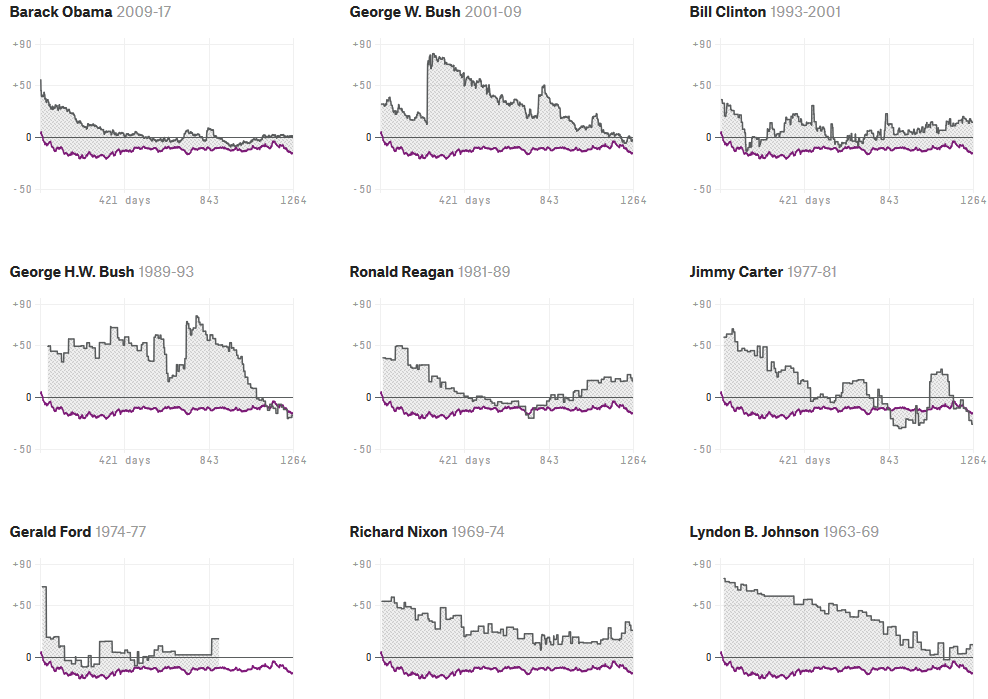
Finally, let’s check in one last time on a few other indicators. Trump’s popularity is more than 8 points underwater with one day to go until the election:

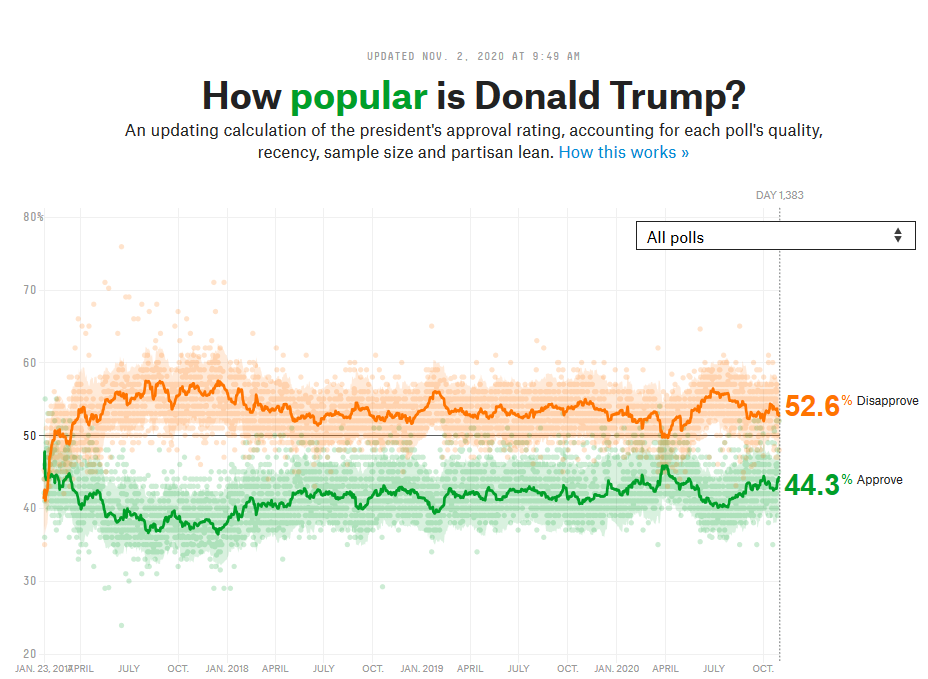
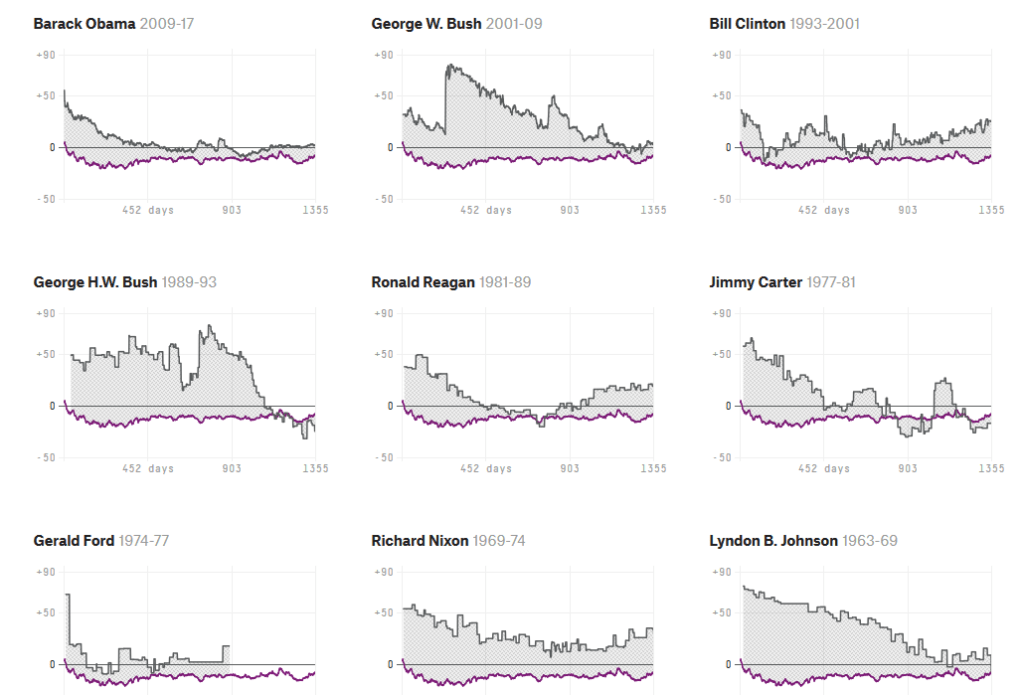
You probably don’t need anyone to tell you this, but that’s not a great place for an incumbent to be. And, indeed, his net popularity is well below any President who was going on to re-election in the past 50+ years. It’s more like Carter or Bush I when they were about to be defeated, or Johnson when he was so unpopular from Vietnam that he’d decided not to run again:

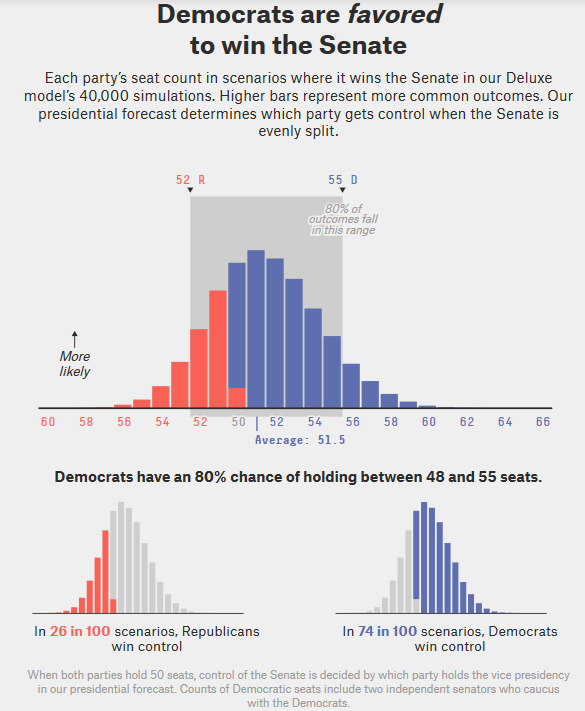
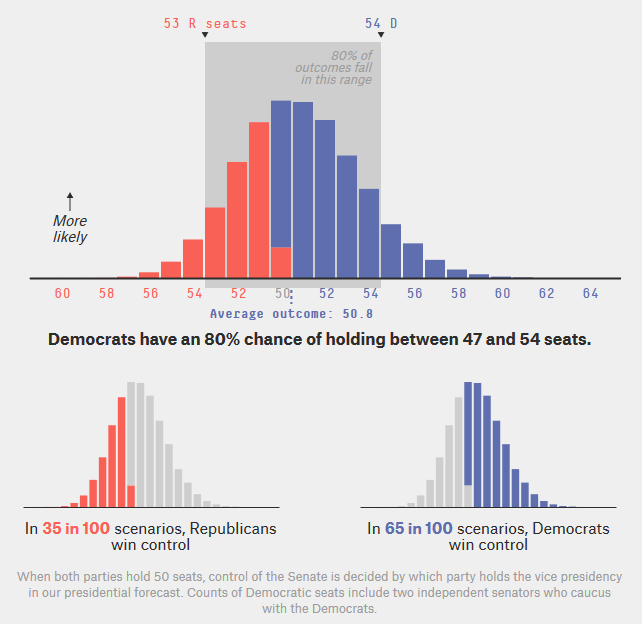
In terms of other elections, the RCP Senate no toss-ups map currently shows Democrats making a net gain of 3 seats, and tied in two others:

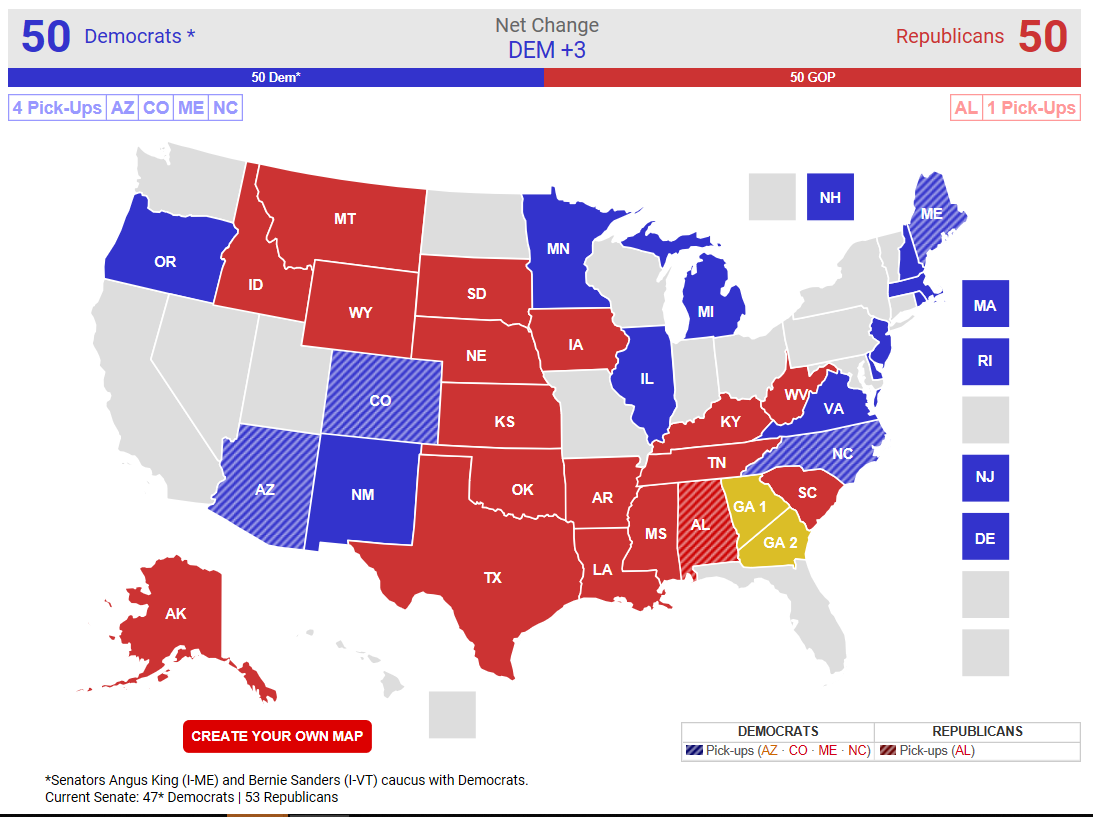
And 538 is projecting a 76% chance that Democrats re-capture the Senate:

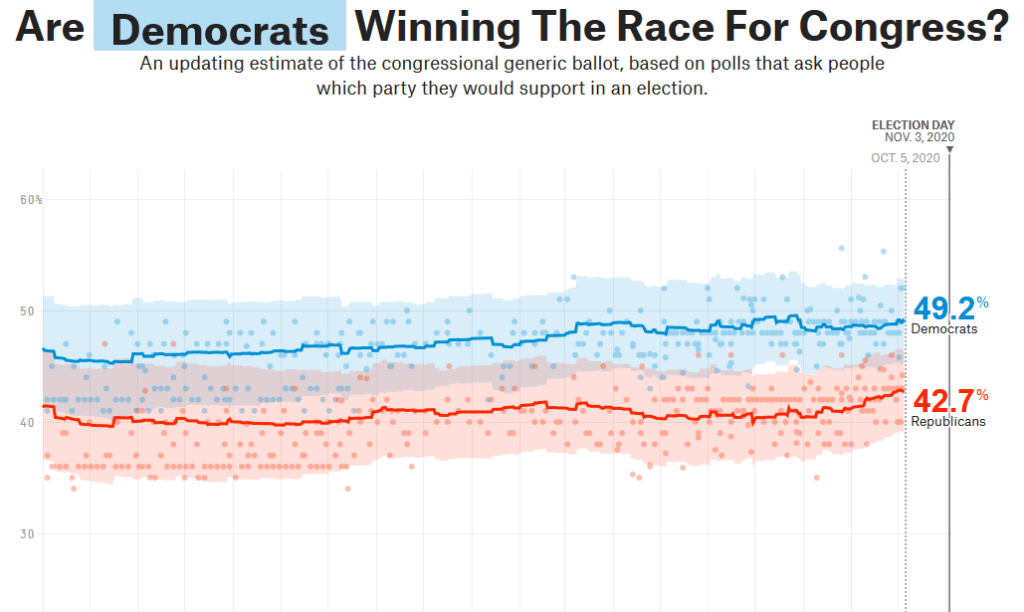
The generic House preference poll shows Democrats with a more than 7% lead:

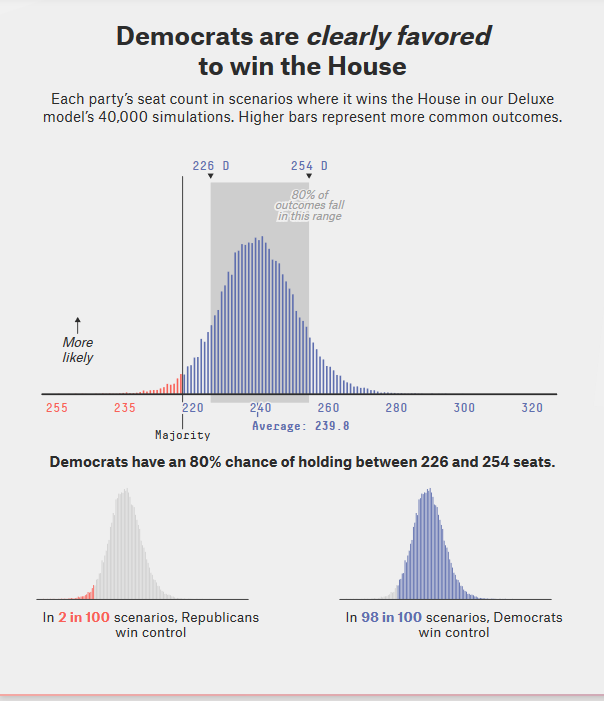
And 538’s model finds a 98% chance that Democrats keep the House, and even slightly increase their margin there:

We’re all understandably gun-shy after 2016. Could Trump win again, despite everything above? Yes, there are plausible scenarios. But every piece of evidence in view tells us that, with 24 hours to go, Biden remains in a very strong position, significantly stronger than Clinton in 2016. So take some deep breaths, remember to pace yourself tomorrow night and in the time to follow, but be encouraged.

And, tune in here in …a week? …two weeks? To see how the data measured up against the results!

Four more years? (two weeks to go edition!)

Buddha bless us and Saints preserve us, two weeks to go! At a month to go, my read of prevailing evidence was that Biden was in a very strong position. What about now?

Let’s start with national polling. RCP’s average currently has Biden up by 8.6%:

538, which takes a more nuanced approach to their average, taking into account the accuracy track record and historical partisan lean of individual pollsters, has Biden leading by even more:

A couple of other national “looks” are worth discussing. It being two weeks to go, we might look back over the past two weeks, and see if there’s evidence of major changes that one might project forward to election day. The short answer is “no”:

To the extent that Biden seems to be solidly ahead, every day with no significant change benefits him. Especially given a factor that we’ll discuss in a moment… Another relevant “look” is comparing where Biden is with two weeks to go with where Clinton was at the same point in 2016:

The same factors we’ve seen all year show up here: Biden is ahead by more than Clinton was at the same point, has had a higher “ceiling” and better “floor” than her numbers, and has never led Trump by less than 4 points, whereas Clinton was frequently within 1%-2%, and twice even trailed Trump.

One additional factor to consider is that who’s been ahead in the polls is not an academic matter. In fact, the election is already 24% over. That is to to say, between absentee ballots and early voting, 33.3 million votes have already been cast, representing 24% of the total from 2016:

One of the reasons Comey’s October surprise in 2016 was so damaging to Clinton was that there were a lot of late deciders on the fence. There are far fewer this time, and almost 1 in 4 votes is already in. And these votes came in during a period when Biden was strongly leading. So even if something damaging to Biden (or great for Trump) arose, it inherently can’t have as much of an effect now as it did in 2016.

National polls and vote totals, especially compared to 2016, do give us an idea of how things are trending. But, ultimately, it all comes down to the states. According to RCP’s latest tallies of the most likely swing states, Biden is leading in all of them:

538’s more nuanced approach shows the following Biden margins for these states:

If we were to take the lower RCP numbers and only give Biden anything above 5% and assume the others are a toss-up, this is the map we’d get:

In this scenario, any one of Florida, North Carolina, or Pennsylvania takes Biden over the top, as would Arizona plus the split electoral vote from Nebraska. Trump, conversely, pretty much needs a full sweep to prevail. And this is before getting around to states that Trump won fairly handily in 2016, but which are toss-ups this time- Georgia, Iowa, Ohio, Texas, and Maine’s split electoral vote.

RCP’s “no toss ups” map showing all current Biden leads looks like this:

Based on these state by state polling outlooks, 538’s model has Biden favored to win:

And the Cook Report and Sabato models both have the “lean Democratic” states alone totaling more than the needed 270 electoral votes:

“But the polls in 2016 were wr-” Okay. I know you all are too smart and too well informed at this point to pull out that tired old chestnut and re-roast it. But just in case, here’s a good discussion of what pollsters have done since 2016 to improve, and what areas they’re still worried about. And there are other data points we can examine…

To the extent that fundraising is another indicator of enthusiasm, the signs for the Democrats are very promising. Biden has been out-raising Trump by more than 50%, Act Blue is more than doubling the take of Republican activist platforms, and the Democratic candidates in the leading Senate races are all solidly out-raising their Republican opponents.

Speaking of those Senate races, they form an independent data point of their own. 538 currently has Democrats favored to recapture the Senate:

And the RCP “no toss ups” Senate map is showing the same thing:

Over on the House side, the generic Congressional ballot shows Democrats leading by 7.4%:

This is actually up about a percentage point from a month ago, and indicates the party is in no danger of losing the House. Indeed, the 538 model calls for it to slightly improve upon the 232 seats it currently holds:

One final thing to check in on is Presidential approval ratings. It hardly needs to be said, but, for the record, an incumbent being more than 10 points underwater with two weeks left to go isn’t a great sign for their re-election:

Looking back over the past 50 years of Presidential approval at this same point drives the point home:

Trump’s numbers look nothing like Presidents who were heading to easy victories. They don’t even look like Presidents who were heading to narrow victories. Instead, they most resemble Carter and Bush 1 when they were both on the edge of first-term defeat, and Johnson when he was so unpopular from Vietnam that he had decided not to run again.

To sum up: No matter what indicators you look at, with two weeks to go, Biden seems to be in a very strong position. Given the relative stability of this race throughout the year, I would be surprised if this changes drastically over the next week. But let’s meet back here in a week and see!

Four more years? (one month to go edition!)

It’s hard to believe. Even more so since we’ve had, like, a year’s worth of news in the last week. But, as of this past weekend, it was officially one month to go until Election Day! When we last checked in a month ago, the conclusion was, “Biden remains in a very strong position with two months to go.” If that was true then, it’s even more so now.

Let’s start with national polling. Using their average of recent polls (also note, the majority of these now include post tax story/debate news, but don’t yet have data since revelations of Trump’s COVID diagnosis), RCP currently has Biden leading by 8.3%:

RCP’s average is “naive” in the sense that it just adds together recent polls and takes their average. Over at FiveThirtyEight, they also adjust their weightings for pollster’s history of accuracy, compare national polls to state tallies for a “sanity check”, and take into account pollsters that have a historical partisan lean in one direction or another. This is certainly a more robust methodology, but at the moment it produces a nearly identical result, Biden +8.2%:

There are two things worth noting about this lead. The first is that it isn’t a meaningless data point, since more than 2 million votes have already been cast, and voting is taking place in more than 30 states right now while Biden has this healthy lead:

The other point worth talking about is margin of error. Even the best polling, irreducibly, has a roughly +/- 3% margin of error. To take the above 538.com numbers as an example, Trump could be as high as 45.7%, and Biden could be as low as 47.9%. That means that, at worst (from his point of view) Biden’s lead could be as little as 2.2%. Of course, equally, Biden might be as high as 53.9%, and Trump might be as low as 39.7%.

This matters because, as 2016 showed us, a narrow popular vote lead can still be an electoral college loss, depending on how the individual states fall. FiveThirtyEight has tried to quantify this, and at a 2% to 3% national lead, Biden has around a 50% chance to win the Electoral College. Of course, this currently looks to be Trump’s absolute best case scenario, and if Biden is ahead by more than 3%, his chances shoot up accordingly.

Did I mention individual states above? Indeed, and that is what the election ultimately swings on. As it happens, Biden currently enjoys a lead in all of the most probable swing states:

Granted that some of these leads are narrow, even restricting the map to just states where his lead exceeds 5% takes him over the top:

If we were to go further and look at RCP’s “No Toss-ups” map of all the states based on current polling averages, we get this map:

Using their sophisticated state-by-state model, 538 is currently predicting an 81% chance that Biden wins:

Note that this model in part reflects the uncertainties of still being a month out. To put this another way, every day we get closer to the election with Biden still having these kind of national and state numbers, that percentage rises. For reference, in 2016 538’s model had a 29% chance that Trump would beat Clinton on the eve of the election. Biden is in substantially better shape than that, as a quick side-by-side comparison confirms:

I do this list a lot, but because I think it’s instructive I’ll do it again!

  • Clinton frequently had a lead as low as 2% or less over Trump, Biden has never had a single day under 4%.
  • At two points, Trump actually led Clinton, he has never led Biden for even a single day.
  • Biden has spent significant time over 50%, and almost no time under 48%, whereas Clinton was often below 48%, and only topped 50% for a single day.

National polls, state polls, and the comparison to 2016 all confirm the notion that Biden is in very good shape with a month to go. What do other data points have to say?

According to FiveThirtyEight’s average, Trump’s net approval rating is currently more than eight points underwater:

To put that in historical perspective, Trump’s net approval numbers are worse at this point than any other President of the last 50 years except for Bush I and Carter, both of whom were about to be defeated:

Democrats are leading the Generic Congressional Approval ballot by 6.5%, meaning that their hold on the House is not in any danger, and could even expand slightly:

RCP’s “No Toss-ups” Senate polling averages map shows Democrats re-taking control of the Senate:

And FiveThirtyEight’s Senate forecast model gives Democrats a 65% chance of doing so:

In short, reference to Trump’s net approval numbers and the House and Senate outlook further bolsters the idea that Biden’s lead is as robust as it appears.

There are, of course, factors that this analysis doesn’t take into account. Election night returns may temporarily show Trump leading before absentee ballots are tallied and reflect the full picture. And Trump has given every indication that he plans to dispute results. But none of that, ultimately, changes the fundamental fact that, a month out from the election, Biden has a very solid chance of prevailing on 11/3/20 (plus a week or two).

Tune in again two weeks from now for the two week outlook!

Four more years? (2 months to go edition!)

Well here we are, with 60 days to go! That frightening image above, by the way, is the “Red Mirage”. We’ll get back to that later. But first, as a reminder, at three months to go, we concluded that things had tightened a little since four months out, but that Biden remained in a very solid position. How do things look now that we’re two months out?

The last thirty days have seen a lot of news:

  • Biden’s VP pick of Kamala Harris
  • Both party’s conventions
  • Trump taking action on a series of executive orders meant to address the economic fallout from the pandemic
  • New national unrest, including murder of protesters, over the police shooting of Jacob Blake in Kenosha, Wisconsin
  • Trump responding by a full-court press to run a “law and order” campaign

In response to all this activity, national polling over the past month has seen…on net, just about nothing. Biden is up 0.2% over a month ago, and Trump is up 0.4%, leading to a net of Biden +7.2% now vs. Biden +7.4% a month ago:

Yes, but the polls in 2016 were wr- Stop! Stop? Stop. It is, however, useful to compare Biden’s year-to-date position in the RCP average to Clinton’s 2016 average for the same period:

One will note that Biden has been above 50% several times. Clinton only ever was for a single day. Biden has almost never been below 48%. Clinton was rarely above 48%. Biden has never had a lead of less than 4%. Clinton was less than 2% multiple times, and Trump was even ahead of her twice. On this same day in 2016, 11% of voters were undecided between Trump and Clinton. Only 8% of voters are between Biden and Trump. Everything about the comparative perspective says that Biden is and consistently has been in a much stronger position than Clinton.

It is worthwhile to note that RCP’s polling average is “naive” in the sense that it just averages all major polls within a certain time period (the last eight days, at the moment). 538’s polling average is a bit more sophisticated as it weights pollsters according to their historical track record of accuracy, and makes adjustments for pollsters that show consistent partisan lean in one direction or the other. Using this methodology, 538 currently has Biden at +7.3% vs. +8.2% a month ago:

In 2016, Clinton won the popular vote by +2.1%. Taking the smaller of the two averages above, Biden at +7.2%, and adding that difference of 5.1% to Clinton’s 2016 state by state margins results in the following electoral map:

That gives us a ballpark of how things might be different this time, but of course state by state dynamics are not necessarily going to be the same as last time. If you look at RCP’s averages of the likely swing states, Biden currently leads in all of them:

This has narrowed within the last 30 days, which is certainly worth keeping an eye on:

However, it should be noted again that Biden maintains a fairly strong and consistent lead in these states. Using its more robust methodology, 538 is currently showing:

  • Wisconsin Biden +7.1%
  • North Carolina Biden +1.8%
  • Florida Biden +4.1%
  • Pennsylvania Biden +3.4%
  • Michigan Biden +6.4%
  • Arizona Biden +4.6%

If we took only those states where Biden has more than a 5% lead according to the 538 averages, we would have this map:

Under this map, if Biden wins any one of Florida, North Carolina, or Pennsylvania, even by a few hundred votes, he’s President. Trump would have to win all three to prevail. If Biden just won Arizona, we’d be at 269-269 and the election would got to the House. May Al’lah forefend against such an outcome.

For their part, RCP’s current “no toss-ups” map shows the following:

There are some other electoral data points worth considering as well. RCP’s “no toss-ups” Senate map currently has Democrats picking up five Senate seats (and losing Alabama) for a net gain of +4, which would flip the Senate:

And the Generic House Preference polling has Democrats up by 7.3%, not far off of the 8.7% that catapulted them to a net gain of 41 seats in the 2018 midterms.

Finally, there are Presidential approval numbers to consider. Trump is currently underwater by nearly 9%:

While that’s actually an improvement from nearly -14% a month ago, on the face of it you might still think this isn’t a good place for an incumbent to be two months out from an election. And you would be right! The only two first term Presidents of the last 50+ years who have been in a similar position were Carter and Bush I, who were both headed for defeat:

What this all boils down to is that national polls, state-by-state electoral college totals, the outlook for House and Senate races, and Presidential approval ratings are all telling us the same thing: Biden remains in a very strong position with two months to go.

Now, a word about our opening graphic. This is what’s being called the “Red Mirage“. Indications are that a large percentage of Biden-leaning voters are planning on voting absentee. A similarly large percentage of Trump-leaning voters are mail voting-averse, and are planning on voting in person. Meanwhile, the individual states have widely varying rules about when absentee ballots must be received by, and the deadlines for starting and finishing counting them.

Because of all this, Election Night returns may show a big lead for Trump, and Biden’s true numbers won’t be apparent until several days, maybe even more than a week, later. There is nothing improper or weird about this, and it doesn’t affect the final outcome at all. But the two dangers it presents are:

  • If you don’t know it’s happening, Election Night could be pretty scary!
  • It presents Trump with a week or more to agitate his followers about the “illegitimacy” of the outcome, something that could be enormously disruptive for the country.

So I would recommend fortifying yourself against the first possibility, and all of us being prepared to take appropriate action against the second. Meanwhile, we’ll reconvene in a month to see how things are looking with a month to go!

Four more years? (3 months to go edition!)

countdown

Is it just me, or was that a fast month? When last we gathered with four months to go, Biden’s position was looking very solid, and even better than it had at five months or six months. How are things different at this point?

To start with, the polling numbers have tightened up a little, but not a lot:

BvT

It hasn’t so much been Biden falling out of his usual range as Trump having bounced back a little from a dismal bottom beneath his usual range. Overall, Biden’s position remains very strong. One thing to keep in mind about the RCP average, is that it’s just that- an average. But not all polls are created equal.

Over at FiveThirtyEight, they address this by weighting pollsters according to their history of accuracy (more accurate ones being given more weighting than less accurate ones) and historical partisan skew (adjustments being made to pollsters that are regularly more +D or +R). This more nuanced approach has Biden up by a little more:

538poll

Another useful way to think about the RCP polls is to compare Biden’s YTD numbers with Clinton’s for the same time period in 2016:

This side by side comparison makes immediately apparent that Biden’s 2020 position is much stronger than Clinton’s 2016 position:

  • Biden has never been less than 4 points ahead, compared to Clinton, who was frequently within 2 points, and twice was briefly behind Trump.
  • Biden has been above 48% 2/3 of the time or more, Clinton was above 48% only 1/3 of the time or less.
  • Biden has had several runs above 50%, whereas Clinton was only above 50% for a single day.

Of course, we in America are blessed with that cute little Constitutional anachronism known as the Electoral College, so national polls can only tell one so much. We do have a pretty good idea from 2016 and trends since then what some of the key states will be, and Biden currently leads in all of them. Not only does he lead, he’s well outside the margin of error in every state here except Arizona:

battlegrounds

If we look at RCP’s current “No Toss-Ups” map, Biden is in very strong shape:

NoToss

Even if one just looks at the states where Biden leads by 5 points or more, the map looks like this:

5plus

“But the polls were wrong in 2016!” First of all, no. Polls can be wrong, but they are rarely 5% wrong. Also, in some of the 2016 states, a major problem was that, because they weren’t widely believed to be competitive, the were under-polled. We may be looking at the wrong states now, but for the ones that were surprises last time, they are very well polled this go-around.

Take Michigan as an example. The current RCP average there is based on four major polls that all have data from the last two weeks:

MI

A final useful check-in is on Trump’s net approval numbers in comparative perspective:

NetPop

One can clearly see that, except for a few days right at the beginning of his term, Trump has never had positive net approval numbers, and has consistently lagged every President of the last 50+ years. The only two his current numbers really compare to are Carter and Bush I, first term Presidents who were going to electoral defeat.

So, while the polling numbers have tightened up a  little, by every concrete measure we have, Biden remains in a very strong position. Let’s tune in again in a month (and after the pseudo-conventions and Biden’s VP pick to boot!) to see what things look like two months out!


Four more years? (4 months to go edition!)

US-POLITICS-TRUMP-INAUGURATION-SWEARING IN

Look, I get it! Of course I do. To be of a Leftward persuasion, and to have closely followed Presidential politics for years is to know heartbreak. The Supreme Court halting the counting in 2000 and selecting Bush as President. Seeing John Kerry haplessly roll over and play dead, losing a winnable election in 2004. “Losing” 2016 while finishing 3 million votes ahead. Michael Dukakis being up 17 points in late July 1988, and going on to lose by 8 points!

So I get why instinctive panic, and a mistrust of any numbers, creeps in. Instinctive panic, however, is both irrational and tactically unhelpful, and data can be clarifying. When we took our “five months to go” look in June, Biden actually seemed to be in pretty good shape. Friday last week was four months to go. Does that still seem to be the case?

Let’s start by looking at the latest polling averages:

JoeB

Biden has a more than 8-point lead. But that’s not all. As I’ve mentioned before, I find it instructive to look at Hillary Clinton’s averages for the same YTD time period:

HC

A few things immediately stand out from this comparison:

  • Biden has been above 50% for about half the time YTD. Clinton was only above 50% for a single day.
  • Clinton was rarely above 48%. Biden has rarely not been above 48%.
  • Biden has never had less that a 4 point lead over Trump. Clinton was down to less than 2% several times, and Trump even briefly had a lead over her.

To me, the conclusion that the Biden campaign is in much better shape than the Clinton campaign was at the same point is unmistakable.

Of course, as we all too sadly know from 2000 and 2016, winning the popular vote doesn’t win you the election, winning the electoral college does. However, being more than 8% up almost certainly wins you the electoral college. If we add the 6.6% higher Biden’s current numbers are compared to Clinton’s final 2016 margin (2.1%) to her state-by-state totals, we get this electoral map:

plus67

2020, of course, isn’t 2016, and dynamics in the individual states may be quit different this time. So what happens if we look at current polling in the potential swing states? As it happens, Biden is currently leading in all of them:

AZFLMINCPAWI

In addition to this, Iowa, Ohio, and even Texas are all close enough to be in play. Polling inherently has a margin of error, even when using polling averages, but just keeping the states where Biden’s lead exceeds 5% results in this map:

moe

One more statistical check-in is helpful here. This is the President*’s net popularity vs. other Presidents of the past 50+ years at this same point in their terms:

net

Lest we forget, Trump is, and has been the whole time, historically unpopular. The only two Presidents his current net (un)popularity looks comparable to are Carter and Bush I, who were both headed to first term defeat.

One last sanity check is to think about these numbers in the larger electoral context. In latest figures, Biden and the DNC are out-raising Trump and the RNC. The Generic Congressional preference numbers are about as positive for the Democrats as they were in 2018, when they gained around 40 seats. Democratic candidates are polling strongly in the swing Senate races. All of this fits together into a consistent picture.

Up above, I asked if Biden’s four-month outlook still looks as strong as it did at five months. The answer, given the above, is a clear yes. If anything, it looks a little better. Take nothing for granted about this- donate, phonebank, textbank, write letters, organize on social media. But be encouraged in doing so, and know that bed-wetting for other than recreational purposes is not called for.

Onward!


There can be only one… (Superb Tuesday in the Time of Plague edition)

1920px-Democratic_Party_presidential_primaries_results_by_county,_2020.svg

In last week’s preview of “Swell Tuesday” I wrote:

“Unless Sanders draws in a significantly larger share than the Progressive candidates in total have so far this cycle, and than he did last cycle, it could be very difficult for him to overtake the “Moderate” block that has coalesced around Biden.

Tune in next week to see if this outlook has changed after tomorrow!”

The very short answer is: This outlook has not changed. And, though there is a significant external variable we must discuss, things are not liable to change after tomorrow either. First, a quick look at the March 10th results:

March 10th

Biden nearly swept the field, and, crucially, easily won Michigan, the site of Sanders’ surprise victory in 2016. Washington still has not been finalized due to the number of outstanding mail-in ballots, but indications are that Biden is headed toward a narrow victory there too (Washington, in caucus form, was another state Sanders had won in 2016). Following these races, this is where overall results to date currently stand:

results3

On the face of it, a 150 delegate lead might not seem insurmountable. As we know from previous years though, it often is. Obama came out of February 2008 with about a 100 delegate lead over Clinton, for example, and she was never able to overcome that despite staying competitive to the end. To do so, the trailing campaign has to be getting more than 50% every election day from then on. And not all election days are created equal…

If two Tuesdays ago was “Super”, and one Tuesday ago was “Swell”, I’d say tomorrow is “Superb”. 577 delegates are at stake in Arizona, Florida, Illinois, and Ohio. Once Wednesday morning dawns, 62% of the total delegates will have been chosen. So it’s a big day, and it will rapidly move things along. Could Sanders catch up? Current indications are not promising:

March 17th

Right now, at 892 to 741, Biden would need to capture 52% of the remaining delegates to clinch the nomination, while Sanders would need 59%. A quick look at national polling indicates that this is very in-range for Biden, and very difficult to foresee for Sanders:

national2

Examining the overall popular vote totals to date for the “Moderate” vs. “Progressive” candidate blocks reinforces this notion:

blocks

As the only remaining “Moderate”, one can easily picture Biden winning 50-something percent of the remaining delegates. As the almost only remaining “Progressive” (sorry, Tulsi), Sanders would have to be doing about 1/3 better than that entire block has done to date to get the 59% of delegates he needs.  After tomorrow, if the above-mentioned state polling indications hold, this number is liable to be even more formidable for Sanders, and even more achievable for Biden.

There is a caveat: The one thing even the best forecast can’t totally control for is major unexpected external events.

Because of concerns about safety around COVID-19, Georgia has cancelled its March 24th primary, and will instead hold it in May. Louisiana likewise is moving  its April 4th primary to June. This is unlikely to change the overall result, which will be pretty much set in stone by Wednesday morning. But it could certainly prolong how long it takes to become official. And the longer a campaign lingers, the more unexpected things may occur…

There can be only one… (“Swell Tuesday” Preview edition)

super-tuesday-2020-results-promo-1583316015941-superJumbo-v2

Well that was really something!

A lot has happened since last we tuned in, one short week ago. It was inevitable that Super Tuesday was going to knock a few things loose in the race. Indeed, even before it happened, as I was hitting “publish” last Monday, Buttigieg and Klobuchar both dropped out, endorsing Biden to boot. Following Tuesday’s results, Elizabeth (this world does not deserve you) Warren and Mike (we’re glad your money is still around) Bloomberg both dropped out as well.

This leaves us with only three candidates remaining: Bernie Sanders, Joe Biden, and Tulsi “she still exists” Gabbard. From 28 that we have had at one point or another to three, bringing us ever closer to the point at which…

there-can-be-only-one

In this regard, Tuesday’s results certainly may give us a clue which way the wind is blowing. As predicted here, Biden had a very good day. Following wins in 10 out of 14 contests last Tuesday, he is now sitting on leads in both the popular vote and total delegates:

results2

It’s also immediately clear what effect Tuesday’s wins, and the endorsements (Bloomberg also endorsed him after dropping out, and former candidates Cory Booker and Kamala Harris have now done the same) have had on Biden’s national polling numbers:

polling

For those not well versed in math, that’s a thirty point gain in one week! Both the establishment, and voters, seem to be quickly coalescing around Biden.

“Ah-ah!” you say. “Not so fast! It’s the vote still to come that matters.”

Indeed it is, and that vote will matter very rapidly. For better or for worse, we’ll have an almost definitive read on how things are looking by Wednesday of next week.  As of now, around 38% of total delegates have been chosen. By the end of the day tomorrow, this will be at around 47% (which is nearly half in most parts of the world). And then after Tuesday next week, it will be almost 62%:

totes

But first up, tomorrow. It’s not a “Super” Tuesday, but it’s pretty good. 365 delegates are at stake, including the electorally key state of Michigan. I’m calling it “Swell Tuesday”.

Sanders’ surprise narrow win in Michigan in 2016 was a major turning point for him, and what should have been an indicator that the state could be a problem in the Fall. With due humility for how far off the polls there were last time, they are pointing in an easy-to-spot direction at the moment:

Michigan

Sanders also did very well in Washington in 2016, but with the key difference that it was a caucus then, and is a primary this time. Allowing for the likelihood that many of Warren’s voters will swing toward Sanders, he looks to be on a path to a win there, but not an overwhelming one like he had in the 2016 caucus:

Wa

Another sizable state up tomorrow is Missouri. It was a virtual tie last time, with Sanders finishing less than 600 votes behind Clinton. One would not bet on it being that close this time:

Mo

Based on his Southern results so far, Biden can be expected to crush it in the remaining large state up tomorrow, Mississippi. He’s also currently favored in both Idaho and North Dakota. What this all adds up to is a likely narrow Sanders win in a state he won big in last time (Washington), a loss in the surprise win state that garnered so much attention for him in 2016 (Michigan), and Biden going four for four on the other states up tomorrow.

If so, and given a March 17th that looks like very fertile territory for Biden, Sanders could run out of room very quickly. Are surprises possible? Certainly. But the fundamental problem I see is this. If you take the grossly simplified view that the candidates can be grouped together into two blocks, this is the popular vote so far:

math

For reference, the 2016 total came out as Clinton 55.2%, Sanders 43.1%. Unless Sanders draws in a significantly larger share than the Progressive candidates in total have so far this cycle, and than he did last cycle, it could be very difficult for him to overtake the “Moderate” block that has coalesced around Biden.

Tune in next week to see if this outlook has changed after tomorrow!

There can be only one… (“Have yourself a Super little Tuesday…” edition)

<Breaking News! Mere moments after I pressed “publish” the news came through that Amy Klobuchar is dropping out, and endorsing Biden. To adjust for this, take everything I say below, and make it more so.>

<And still more breaking news! Buttigieg has come out saying he plans to endorse Biden in a joint appearance. Take what I say below, and make it even more so more so.>

St2

As promised in last week’s pre-South Carolina check-in, now that we have South Carolina results, we’re back for a quick check-in today, before tomorrow’s nation-wide electoral hoe-down.

First to note: In the wake of South Carolina, Tom Steyer and Pete Buttigieg have dropped out of the race. From 28 total and as many as 25 at once, we’re now down to just six candidates! We see you, Biden, Bloomberg, Gabbard, Klobuchar, Sanders, and Warren. You’re a plucky bunch, but, sooner or later…

there-can-be-only-one

Do we have more of a sense who that one will be? One thing we can observe in South Carolina is that Biden won big, even bigger than many expected:

SC3

One consequence of this final member of the first four elections weighing in is that, literally overnight, Biden has shot to the lead in the popular vote, and a close second to Sanders in total delegates:

state of states

Of course, this is based on a very narrow slice of the overall electorate so far. Tomorrow, in a shot, will take us to more than a  third of the total delegates having been chosen. So what’s the outlook? As recently as two weeks ago, it seemed quite possible that Super Tuesday would be an extinction level event for Biden, and Sanders would sweep the field that day.

But then, as we discussed last week, Biden caught a couple of good breaks going in to South Carolina- a Nevada performance that was less dismal than his first two outings, his main rival Bloomberg being gutted by Warren in his first debate, and strong support in South Carolina itself. You can see the results both in national polling and polls of a few of the major Super Tuesday states, all of which show Biden’s numbers spiking:

polssss

Keep in mind that these are polling averages, and have limited effect so far from his South Carolina win, or possible benefit from Buttigieg dropping out.

Considering where his trendlines were already going, how many southern states with similar electorates to South Carolina are voting tomorrow, and the general momentum from his recent win and a “moderate” rival dropping out, it’s not unreasonable to expect Biden to do much better tomorrow than it seemed just a few weeks ago. Indeed, the number-crunchy folks at 538 now give him odds on winning Alabama, Arkansas, North Carolina, Oklahoma, Tennessee, and Virginia tomorrow, and a roughly even shot at carrying Texas.

St3

If you put all this together, I’m smelling a very good day for Biden tomorrow. Sanders probably comes out of this with a plurality of the popular vote and delegates, but Biden will also likely be racking up enough votes and delegates to be nipping right at his heels. Time shall tell, but not much of it, so we won’t have to wait long to see!

There can be only one… (“First South Carolina, then the World!” edition)

2020_south_carolina_primary

Since last we checked in, there have been two more contests, the New Hampshire primary and the Nevada caucuses.

New Hampshire continued Iowa’s theme of “near photo finish” but advantage Sanders, and also featured a dismal fifth place by Joe Biden that opened up the question of whether he’s in complete free-fall:

NH2

Nevada featured a strong win by Sanders across multiple demographics, and his third popular vote victory of the first three. Which, following on the heels of his coming in to the lead in national polling, caused some to wonder whether he might deliver a de facto knockout punch on Super Tuesday:

Nevada

Oh, and we’ve also had some further attrition due to New Hampshire! Goodbye Bennet, Patrick, and Yang! Delaney, I didn’t even notice you’d dropped out back in January! Of the 28(!) candidates we’ve had at one time or another, with a simultaneous field as large as 25, there are now only eight remaining. Eight is fewer than 28, but…

there-can-be-only-one

What does how things are looking going in to South Carolina tell us about who that one is likely to be?

After placing fourth in Iowa and fifth in New Hampshire, once front-runner Biden began to look like he might totally collapse. But, three (from his campaign’s perspective) useful things in a row happened. First, his Nevada showing, while not great, was a step up from the “on life support” numbers of Iowa and New Hampshire.

Second, the “moderate/establishment” vote had clearly started to flee from Biden to Michael Bloomberg, who isn’t on the ballot in South Carolina, but does serve as a kind of anti-barometer of how Biden is doing overall:

National1

However, as his star rose, rumblings also rose about whether Bloomberg’s past association with racially troubling policies and statements, sexual harassment allegations, and, well, actually having been a Republican, might make him unacceptable to too wide a portion of the Democratic base. I can testify that on my personal social media feed, many people who are not at all the “usual suspects” for this kind of thing were saying that he could be their exception to “I will vote for whoever the nominee is”.

This came to a head on 2/19, with Warren brutally and effectively taking Bloomberg to task during his first debate appearance. It was so effective that, as some online pranksters put it:

COD

Third, Biden has attracted the support of one of the most influential endorsements there is in South Carolina, third-ranking House member Jim Clyburn:

clyburn

Was it that Nevada stopped the bleeding? Bloomberg being rapidly discredited as an alternative caused some of the nervous voters in search of a moderate to flock back to Biden? The networking and attention Biden has sunk into South Carolina paying off? Whatever the cause, he seem to be having a resurgence there just when he needs it most:

SC1

While just a few days ago it seemed like Biden might be headed for an embarrassing single-digit win or even a devastating surprise loss, I think he’s probably back on track for a strong double-digit win in South Carolina. And, of course, the real significance of South Carolina has always been momentum going in to Super Tuesday, and especially what it tells us about how well Biden is doing with the African-American voters he’s counting on to win Southern Primaries that day.

In which regard, if a big win in South Carolina does presage Southern strength for him, he could pick up as many as six states that day:

ST

This doesn’t change the fact that Sanders remains in a very strong position to also pick up a lot of delegates that day, quite probably even more than Biden. But South Carolina’s results this weekend may tell us a lot about whether we’re likely to see a “knockout punch” by Sanders on Tuesday of next week, or more like an almost-draw that keeps us all slogging through for a while to come.

Let’s check in again on Monday!