Why I Am Rejecting the Call to Whiteness

immigration-history

In the midst of the 2016 election writer, journalist, and astute political commentator Farai Chideya posted a draft essay on what she calls The Call to Whiteness. In her view, an appeal to White Nationalism is one of the powerful forces behind Trump’s rise, and even whites who don’t identify with it at all have to grapple with it. Because it’s being issued, wanted or not, in their name. The whole short essay is well worth reading, but I’ll highlight here the closing section:

“It thus remains very much up to white America to control the baser urges of the call-to-whiteness. You are not above it, particularly if you have not bothered to learn about it — and especially if you claim it doesn’t exist or doesn’t concern you. The call-to-whiteness is being invoked in your name. Can you hear it now? And how will you respond? The world is waiting to know.”

So, for the record: I am rejecting the Call to Whiteness.

I’d like to talk about why. There are, of course, the vitally important and obvious “whys”:

  • Heeding it puts one on the wrong side of some of the worst events and systems of the last few centuries.
  • Race, biologically, is an unfounded fiction. It’s a social construct.
  • Race, as a social construct in America, is part of a structural system of Racism that benefits white people in so many ways that it’s practically invisible. Saying we should all be colorblind without taking further action to dismantle the system isn’t equality. It’s an attempt to keep the inequality invisible.
  • The idea that there’s oppression against whites, and especially against white men, is patently ridiculous in an America in which more than 80% of all top-level positions in business, government, and media continue to be help by white men. A small reduction in that total doesn’t constitute oppression. It’s just a slight re-balancing toward demographic reality.

But there’s also a series of experiential reasons that the Call to Whiteness makes no personal sense to me:

  • Having grown up in Coastal California in the 70s and 80s, there was literally never a time in my life that multiple colors, cultures, and languages weren’t a part of my everyday experience.
  • Being a bookish, uncoordinated, nearsighted boy with no aptitude for or interest in sports in American public school taught me a little something about how it feels to be a denigrated “other”.
  • Spending about 10% of my life living in various parts of Asia gave me plenty of experience of being someone who sometimes needs the comfort of their original language, who everyone else on the train is staring at, who people cross the street to avoid running in to.
  • In my working life I’ve been, variously, the only white person in an all-Chinese office, a straight employee at an LGBT-focused media company, and, quite frequently, one of a minority of men at the table in a non-profit or educational institution with largely female staff and managers.

I don’t pretend for a moment that my experiences equate to what it’s like to be the racial, gender, or sexual “other” in America. As a straight white male, I have experienced, and will continue to experience, many advantages and forms of ease I’m hardly even aware of. But my particular slice of life has given me an instinctive sympathy for the experience of those on the flip side of the American “Dream”.

I’m reminded in this respect that Bubble is as Bubble does. Yes, living in a multicultural urban setting constitutes a “bubble”. But, as several commentators have noted lately (here and here, for example) coming from a  rural or predominantly white world is no less of a bubble.

All of the above is why I am rejecting the call to whiteness. White friends, what about you?

While you contemplate your answer, the last word goes to a true American hero:

bw-white-background

Warrior

ww

Every four years, there comes a time when my blog posts, due to a life-long fascination with politics in general, and love of presidential electoral politics as my form of major league sports in particular, take a political turn. And then, once the election is over and things settle down, I return to all the other things I love to write about: Music. Writing and publishing. Geek culture. Science. Spirituality.

What I want to tell you now is, I absolutely would have done it.

If Hillary Clinton had won, I would have sunk back into my personal concerns and a kind of semi-apathy. I would have liked some things she did, disliked others, tut-tutted at the opposition, occasionally posted a story online or signed a petition, but that would have been about it. If it had been a “normal” Republican, a Jeb Bush, say, or a John Kasich, I would have been a little more active. But not much.

Return to normal, however, is no longer an option. This is not normal. Donald Trump is the most personally reprehensible nominee either party put forward in a century or longer. Maybe in ever. He doubled down on this by repeatedly attacking the very foundations of democracy and decency throughout his campaign. And since his “election” and inauguration, he’s tripled down on that by showing that he meant every poisonous, un-American word of it.

So I’ve been marching. Organizing like-minded people. Petitioning my Representatives. I made an offhand comment to a friend that this election made me a militant. Looking at the definition, though, that’s not quite right:

adjective
adjective: militant
  1. 1.
    combative and aggressive in support of a political or social cause, and typically favoring extreme, violent, or confrontational methods.

I’ll be confrontational certainly, but I’m not aiming to be violent. I know there are those who disagree. I still believe that it is possible to be active and fully committed without being violent and hating those who disagree. But even non-violent soldiers are still soldiers, and we must steel ourselves for the fight.

That brings us to another notable thing about the word militant. It comes from the 15th century Latin “militare” meaning “to serve as a soldier”. Which brought to mind one of their new favorite dismissive phrases for us: “Social Justice Warrior”. I would like to pick up that mantle.

They are abso-fucking-lutely right, and I am thrilled to be called a warrior on behalf of justice for all members of our great society. I’m starting with the methods our Democracy affords us. But make no mistake, we will not surrender justice and freedom to this budding despot. Our values are better, we’re in the right, and we will defend them, come what may. 

I do hope to keep writing about my favorite things. But I’ll also be writing about this. A lot. One of my primary weapons is the creative word. We’re in the fight now, for at least the next four years, and I will use all the best weapons at my disposal. I am a warrior.

amazon


Let’s Get Rejected!

Forgive me, dear readers, for my lack of communication of late.

My goal for 2016 had been to do a post a week on average, with an awareness that I would certainly slip from that target. I ended up at 25, which is solidly every-other-week in some parts of the world. Hey, not bad!

As of this moment, I haven’t written any posts since early November. You can cite all the usual suspects- distracted by grief, and then rage, at the political boondoggle my country has embarked upon, the standard holiday swirl and subsequent recovery from it, a hideous confluence of project deadlines at work, a family issue- but the point is, I’m back. And rarin’ to go!

More specifically, I’ve decided that one of my goals for the year is to get 100 literary rejections. This idea has been floating around for some years, and is based on a simple premise: if your aim is to collect a mass of rejections, to get there you’re going to have to submit a lot. And if you’re submitting in that volume, you’re much more likely to get some successes along the way. It’s also a fun way to reverse the polarity, making the “no” the goal rather than a dreaded rebuff.

You can read some interesting recaps of other’s experience with it here and here.  For me personally, I was most immediately inspired by following the exploits of my friend (and coincidentally also the person who gave me my first publication) Loren Rhoads as she did it over the last year. In terms of logistics, I think it will have to look like this:

  • My submission stats from 2008-2016 indicate that I get some kind of response 75% of the time. This suggests that I’ll have to do 134 submissions (134 x 75%=100.5).
  • But wait! Sometimes, quite by accident, I get published! So far, an average of 6% of my total submissions over 2008-2016 have been accepted. So, really, I’ll need 143 submissions in order to get those 100 rejections. (134 x 1.06=142.04, and I’m a  “round-upper”)
  •  Around 3 submissions a week ought to get us there. My highest rate so far was in 2015, when I did 44  short fiction/nonfiction/poetry submissions, 7 novel draft submissions, and 7 poetry collection submissions. That’s 58 total, or a little more than one a week on average.
  • I’m going to have to step up my game! Ulp.

So there’s the challenge. I’ll be sharing my experience of it with you all along the way!


Election 2016: Final Update!

voted

So, it turns out just enough space opened up in my schedule today for a quick lunch-time update to my 88 hours to go post from Friday. This really will be the final one though, since I’m in vendor demos all day tomorrow, and then home to watch results!

If you recall from my last post, at this stage it really is all about margins and momentum. I’ve updated the tables from that post, and on the popular vote front we find:

shift1

Extremely amusingly, despite plenty of movement in the individual components, the net effect is that each candidate went down slightly over the past three days, and they have the same net today that they did on Friday. No evidence of further last-minute movement toward Trump, and, based on these numbers, and assuming a roughly 6% third party vote and 50/50 split of the 4.5% remaining undecided, we’d end up with Clinton 48.9% to Trump 45.2%. Now, 3% is around a typical poll’s irreducible error-margin, so the end result could be higher or lower, but we can say that Clinton looks to be ahead outside any margin of error.

In the swing states that actually matter for the electoral college, we see the following (I’ve added Michigan, since a flurry of activity from both campaigns seems to indicate they think that it could be in play (or else they’re trying to fake each other out, which does happen)):

shift2

As one might expect this late in the campaign, nobody’s moved all that much- all margins are up or down within a half percent of where they were Friday. It does dispel the notion that Trump is having any kind of last-minute surge, though. Given the margin and momentum, Arizona, Georgia, Colorado, Michigan and Pennsylvania don’t really seem to be swingy, which would lead to this map:

270v1

This is about where we were on Friday- Clinton is one shy of the 270 needed, and for Trump to win he would have to take all six remaining swing states and the split electoral vote from Maine. He’s only leading in two of the six (Iowa and Ohio), and in one of the six (New Hampshire) Clinton has a steady lead with no signs of further erosion. If this holds, it would make her President, as follows:

270v2

In which case the remaining three states would be superfluous, although victory in Nevada would help pad out her map, and North Carolina or especially Florida would make it possible to experience an upset loss in one or more other states and still pull through. All-in-all, not a bad place for her to be. And early voting totals in all three states are looking very good for Clinton, especially Nevada, where a surge in Latino voters has already banked enough votes that Trump would have to beat Clinton by double-digits on election day to still take the state.

I don’t have time to do pretty graphic inserts for all our other indicators. But it doesn’t really matter, because they aren’t too different from Friday, and, crucially, not a single one favors Trump:

indicators

While Clinton’s lead in the popular vote and her probable margin in the electoral college has gone up and down, it’s worth remembering that, over the last 6 months, Trump only ever had a lead for an aggregated total of eight days:

rcp

Exactly as one would suspect from this, it is much more likely than not that Hillary Clinton will be elected the next President of the United States tomorrow.


Election Check-in: 88 Hours To Go!

mappie

Well, here we are, the Friday before the election. Almost made it, America! And, in contrast to how it might have seemed ten days ago, it’s looking like it could be a lively and interesting night on November 8th. We’ll check in on several of our standard indicators, but really at this point it’s all about margins and momentum. So let’s take a look at that.

First, let’s look at the movement in three leading poll aggregators over the last week. RCP is the most “conservative”, in the sense that it takes a small set of polls, and only does a straight mathematical average. HuffPost is the most “liberal” in the sense that it includes almost all polls, and then does regression adjustments on them. 538.com is a data-rich medium, which includes a wider array of polls than RCP, but more selectively than HuffPost, and weights them according to historical accuracy of the pollster, and makes adjustments for historical partisan bias of various pollsters. These three averages include some of the same data across them, some different, and treat it in three different ways. If we average them all, we get:

shift

There are a couple of things to note here. First, Trump has definitely gained over the last week, but he hasn’t done so at the expense of Clinton, who’s average all-in is unchanged. The most likely explanation is that Republican-leaning voters who had been on board with Johnson or undecided are now coming home to the Republican party in the wake of the latest FBI kerfluffle. Second, Clinton’s lead is probably outside a margin of error of roughly 3%, albeit narrowly.

What if we assume the same thing happens over the next four days that did over the last week? That would leave Clinton unchanged at 47%, and gain Trump another 1.7% to bring him to 45%. At this point, assuming current Johnson+Stein polling of around 6% is right, that would leave just 2% undecided. Looking at the makeup of the current undecided/uncertain vote, there’s no clear indication of a decisive break toward either Clinton or Trump. This is kind of a Trump “best case” (all remaining movement is toward him, and he gets a 50-50 split of undecideds), and it still ends up with Clinton-Trump 48%-46%.

The rub, of course, is that the popular vote doesn’t determine who becomes President. The Electoral College does. Looking again at our above three poll averagers, and adding in DailyKos, who doesn’t do a  national polling average but does track individual states, we see the following movement in what are commonly considered “swing states”over the past week. Since it’s a lot of data, I’m just listing the margin between the two candidates (+ for favoring Clinton, – for favoring Trump):

shift2

The same shift toward Trump in National margin is apparent in every state, sometimes to a  greater extent, sometimes less. The other thing that you immediately notice is that some of these aren’t really swing states at all. Colorado and Pennsylvania have Clinton margins outside the margin of error, and remain in her column even if Trump makes further gains over the next 4 days equal to what he did the past week. Similarly, Georgia has a Trump margin that’s unlikely to go anywhere. Adding these to the “safe” map for each candidate, you get the following:

270

You could look at this map, in conjunction with the state numbers above, in two ways:

  1. This is a pretty good map for Clinton. Even with further shifts against her, she probably has 269 electoral votes, and Trump can only win if he takes all 7 swing states, and peels off one of the electoral votes in Maine (one of two states that splits its electoral votes). Clinton currently has leads in three of them, and Nevada is 50-50.
  2. This is an extremely borderline map for Clinton. She still has leads in New Hampshire, North Carolina, and Florida , but if the next four days see further movement for Trump equal to the last week, all these leads could go away.

So, in other words, Clinton very likely is headed toward a popular vote win. But even if she’s ahead nationally, the following three electoral college maps are all plausible (I’m splitting Maine in one of them, but not fiddling with the outside chance that McMullin takes Utah, which is an additional wildcard):

case-1case-2case-3

I would advise looking carefully at the updated state averages on Monday (I may publish an update Monday if I have time, but my schedule is looking dicey). In the meantime, let’s take a look at what various sources are saying. Because saying that all three outcomes are possible (or even a larger Clinton blowout, or Clinton collapse) is not the same as saying that they’re all equally likely, and your best bet is still look at an array of indicators.

Even after the FBI scare, Clinton still has about a 6 point edge in lower net unfavorability compared to Trump:

The RCP “No Toss Ups” Map shows the following:

nts

The DailyKos forecast model has this:

HuffPost’s model shows the following:

270towin.com’s 10,000 simulations a night are returning the following averages:

to-win

And 538.com is currently showing:

538

Note that 538 shows a much lower confidence level than the others. What this essentially boils down to is a difference not over what the polls are saying, but how likely it is that the polls themselves are wrong. 538.com builds into its model a higher chance that, although state totals indicate a Clinton victory, there could be a polling error of a magnitude such that the polls are wrong. Not a 100% chance, but not zero either, thus they end up around 70/30 instead of the 90%+ that the others are at.

The aggregated betting markets at Predictwise.com are somewhere in-between these two levels:

bet.PNG

And, finally, President Obama’s approval rating remains at a level that could indicate Democratic victory:

approv

With less than four days to go, based on the preponderance of all available indicators, Hillary Clinton is quite likely to be elected the next President of the Untied States on Tuesday. There is one final relevant indicator: You.

GET OUT AND VOTE!


Election 2016: Two Weeks Notice

weeks

I really despaired of making it this far! It’s actually been both better and far, far worse than I would have imagined. But, putting aside the chance that one candidate refuses to concede the results and stirs up armed revolt, the election will indeed be over in two weeks. I’m as happy as the little pyromaniac girl in the above meme. Who hopefully is not a preview of things to come…

Hey! Do you know who usually wins a Presidential election? The candidate with higher likability. In our case this year, that translates to the candidate with lower net unlikability. But there is a clear difference, with Clinton in single digits at -9.6% net favorability, and Trump over 2x higher with -24.5%:

Two weeks out, you would predict on this basis that Clinton will very likely be the winner. What do the polls say? Amazingly, the same thing! Here is RCP’s polling average for the period of May 11th (the day Trump became the presumptive Republican nominee when Kasich and Cruz dropped out after losing Indiana) to today:

rcp

A word about “rigging”: Let’s say you have an average of hundreds of polls over five months by a range of media, educational institutions and private foundations, many of whom even have a house tendency to skew Republican. This average shows that the Democrat has led the Republican in an average of recent polls every single damn day except for two four-day periods, and has a lead of around five points with two weeks to go. If you see that Democrat win, you are not seeing a stolen election. You’re seeing exactly how voters have told pollsters they’re going to vote.

RCP is not the only poll-averaging game in town. HuffPost Pollster also does a polling average, to which they further make trendline adjustments. They have Clinton ahead by around 7 points:

huff

Ah, but what about that wily electoral college? RCPs map of “solid” and “lean” states currently shows a narrow Clinton victory even without the remaining swing states:

rcp-electoral

Their “no toss-ups” map expands the margin even further:

notoss

A word about “rigging”: Let’s say you have an average of hundreds of state polls by a range of media, educational institutions and private foundations, many of whom even have a house tendency to skew Republican. This average at two weeks to go shows that the Democrat wins the electoral college even without the close states, and wins it by a lot more when all the narrow leads are added in. If you see that Democrat win the electoral college by a large margin, you are not seeing a stolen election. You’re seeing exactly how voters have told pollsters they’re going to vote.

270towin runs 10,000 simulations a night using the latest state polls, and comes to a similar conclusion:

270

The simulation’s margins have been wider and lower at certain points, but they’ve never shown Clinton not winning:

270med

All of the above are based on “where things are now” in some form or another, and there are still two weeks left. Nobody in modern Presidential history has come from the kind of position Trump is at now two weeks out and gone on to win, but it is worth pointing out that now does not equal Nov. 8. Forward looking models using various means of taking current data and projecting out are showing the following at 538.com:

538

HuffPost:

And DailyKos:

dk

You may notice that 538 is projecting somewhat higher odds for Trump than anyone else. if you want a really data geeked-out discussion of why, read here. Not to be outdone, an average of thousands of bettors over several betting markets are also overwhelmingly forecasting a Clinton victory:

bet

Finally, there is the theory that an election is a referendum on the incumbent, even when the incumbent isn’t running again. If so, Obama’s net job approval rating over the last few months would also indicate a Democratic victory:

approval

It hopefully doesn’t need to be said again, but every last indicator on the board would lead you to expect that Clinton will win. And, while the margin has been narrower at some times than others, this has been consistently true for the whole period since the primaries ended.

A sizable Clinton victory in two weeks isn’t a sign of a stolen election, it’s what you’d expect to see based on all available data.


Election 2016: One Month To Go!

index

Technically, 31 days, but that’s monthish. And, I mean, how many of us felt like we would never even make it this far? Even better than our group survival thus far, the data is now worth looking at as well.

If you recall some of our earlier analytical forays, a year out, any poll is just about worthless. At 6 months, they’re still not very indicative. By two weeks after both conventions are over, they start to be meaningful. And right about this point, 10 days or so after the first debate, they actually have a pretty strong correlation with final results. So, keeping that in mind, here’s how things look.

On the favorability front, Clinton continues to experience a net unfavorability unprecedented for a major party’s nominee. But, crucially, her gap has closed to single digits post-debate, and remains significantly lower than Trump’s also historically unprecedented unfavorabilty:

We’re probably now at the stage where this gap in their gaps, which has been consistent for months, matters. On the actual how-people-will-vote polling front, Clinton was already on an upswing from her mid-September lows before the first debate. Since then, her position has been further consolidated while Trump’s has turned back down:

polls

Whereas RCP does a straight poll averaging, HuffPost’s Pollster has a somewhat different averaging method that includes trendline results, and is showing an even wider margin for Clinton:

huffpo

State-by-state, the effect of this net change has been dramatic. When they were within a point of each other, her Electoral College margin was a razor-thin 272-266. The current 4-point national lead has swung several of the swing states back from pink to light-blue, and the RCP no toss-ups map currently looks like this:

no-toss

270towin.com’s simulator runs 10,000 simulations a night based on averages of all recent state polling, and it has Clinton winning more than 90% of the time:

270

The crucial caveat is, of course, that the election is not being held today. 538.com’s model projects out the 31 days from now result based on current state polling, with weighting based on the pollster’s history of reliability and partisan bias, and further trendline adjustments based on demographic correlation between states and whether the national polls show a variance to state totals. They then run 20,000 simulations a night. Their “polls-only” model is currently showing the following:

pollsonly
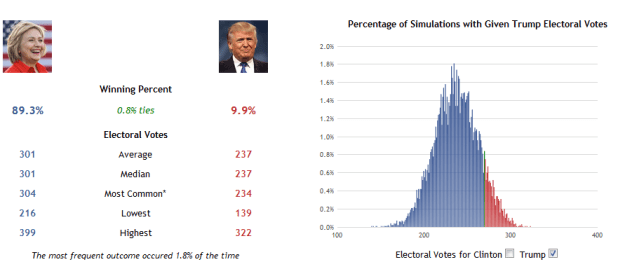
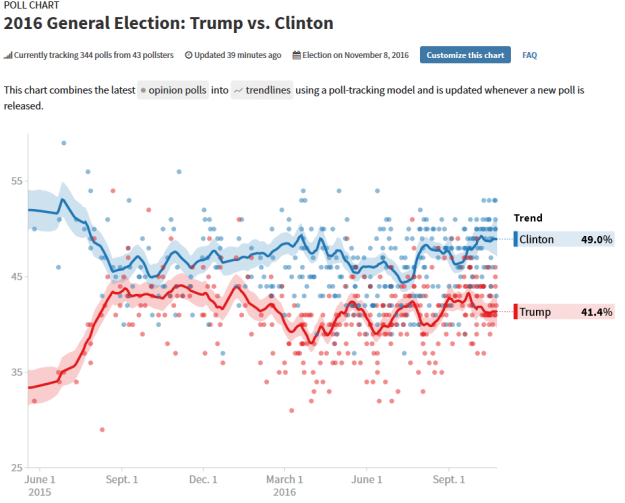
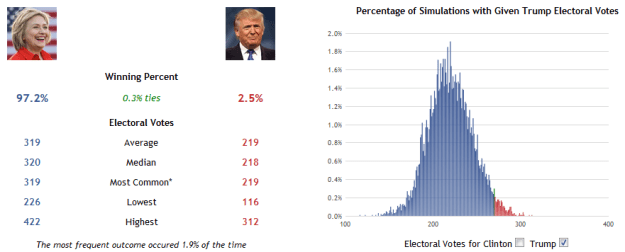
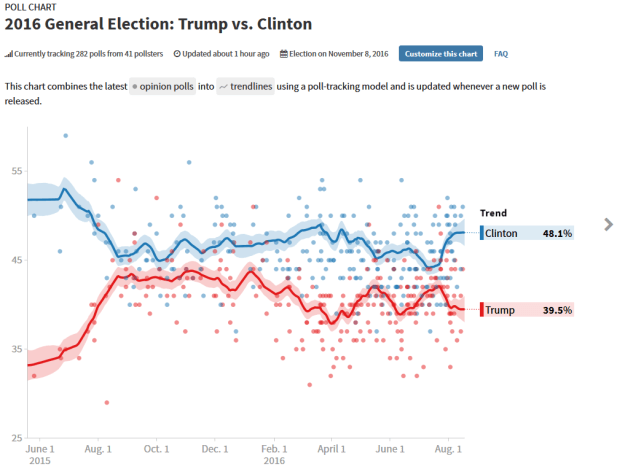
They also have a “polls-plus” version that includes what you would expect for the incumbent party based on economic performance in the mix. As election day approaches, the two converge, since it’s assumed this is increasingly “priced in” to the polls. This model remains a little more conservative than “polls-only”, and it is showing the following:

pp

It’s always nice to have someone else doing the math too as a sanity-check. DailyKos employs a predictive model that similarly uses regressions and trendlines, and is producing broadly similar results to 538.com:

Meanwhile, the betting markets have several thousand users who are actually ponying-up on what they expect the result to be. Predictwise.com aggregates the results from several of these markets, and they are strongly expecting Clinton to win:

precit

Finally, we can look at the incumbent party President’s approval rating. Obama has had a net positive rating for about 6 months, has been above 50% since August, and has trended up even more strongly in the last few days:

obam

There are other factors that we could examine data on: Clinton has a strong edge over Trump in field offices in key swing states, while Trump is doing very well with White Men without a College Degree, he is actually doing worse than Romney among White voters overall, and the uncertainty in the forecasts is decreasing as fewer undecided and third-party voters remain. These factors, and every one of the above indicators, signal that Clinton remains the likely winner.

Could there be an unexpected change? Always yes. But Wikileaks has pretty much fizzled out on having an October surprise up its sleeves, the pluses and minuses of both candidates are well known, and high-magnitude changes at this stage of a campaign are unusual. We’ll check in again on October 26th, and see how it looks with all three debates concluded, and only two weeks remaining!


State of the Race on the eve of the debate


debate

Good news for my blogging life! I’ve finished the final draft of my screenplay (at last!) and it’s starting to make its way out into the world of submissions. Which should free me up to return to more regular blogging.

As it happens, this is a fortuitous time for an update on the election- we’re 45 days from the finish line, on the eve of the first debate, and have a body of polling that’s now fully absorbed the reaction to Clinton’s “basket of deplorables” remark, and her giving fuel to the ridiculous Healtherist fire by fainting from (and not immediately coming clean about having) pneumonia. So, how do the numbers look?

A popular (and pretty reliable) shorthand is that the relatively more “likable” candidate usually wins. It’s a bit hard to gauge in this case, since Clinton has a historically unprecedented double-digit net unfavorability:

clinton unfav.PNG

This would normally be the kiss of death, except Trump’s has consistently been even higher, and remains so through today, even after Clinton’s bad news stretch:

trump unfav.PNG

Of course, what actually happens in an election is that people vote, not weigh in on favorability. Looking at the RCP polling average, you can certainly see that Clinton’s bad weekend cost her:

pols

At one point, her average margin over Trump was down to 0.9%. Since then, though, it’s started to expand again. But guess what? It isn’t actually about how people vote! Or rather, it is, but in specific states, depending on how they add up in the electoral college. Here, the shifts of the past two weeks have turned several of the light blue swing states pink, leaving Clinton with only a narrow margin:

electoral

Now, there are a few ways to look at this. You could make the case, as RCP analyst Sean Trende does, that Trump behaving exceptionally well under the influence of his new campaign team and Clinton having a horrendous week, combined, still weren’t enough for him to pull ahead. Or you could make the case, as 538.com does, that indications of Clinton’s polling rebound are mixed, and her reliable states are only just enough to get her over the electoral college finish line.

Speaking of 538, their “polls-only” model, crunching all state and national polls, making adjustments for polling firm track-records of of reliability and distortion toward one party or another, trending them forward to election day, and averaging the results of several-thousand trail runs, shows the following:

po

In other words, on average, Clinton carries the popular vote by over 2%, and has a fairly narrow electoral college victory. Her reliable states are the same 272 that the RCP average shows, with Nevada and Florida being pretty close to 50-50 (as indicated by their being light pink). If her polling numbers improve a percentage or two from here, her electoral map gets more solid. If they decline, it stays razor-thin.

Their “polls plus” forecast also weighs economic fundamentals into the forecast. It’s typically a bit more skeptical than polls-only, since the economics indicate more of a 50-50 shot for the incumbent party. However, it weights the economic factors less strongly as election day approaches, figuring everything is more “priced in” to the polls by then. Currently, it’s not too different from “polls only”:

pp

HuffPost’s model does something similar, combining weighted poll averages with trend-lines, and it has Clinton ahead by around 4 points:

huffpost

270towin.com runs 10,000 simulations a night based on the latest state polls, and it currently shows Clinton winning the majority of those simulations:

270

The summary of betting markets at predictwise.com is still pretty bullish on Clinton winning:

predict

Finally, the popularity of the incumbent party can be an indicator. It doesn’t have the greatest track record in years when the incumbent isn’t running for reelection, but is still worth looking at. Obama’s approval numbers shifted into net positive in March/April, and remain fairly strong today:

obama

One thing that I think is important to keep in mind is that, even on a strong run for Trump and coming off of a bad one for Clinton, there isn’t a single indicator on the board that has him ahead. Based on all available data, if the election were held today, you would expect Clinton to win. Somewhat narrowly, but win nonetheless. Unless the debates make things markedly worse for her, or notably better for Trump, the advantage remains Clinton’s.

We’ll tune in to the numbers again on October 7th, at which point we’ll be two weeks past the first debate, a few days after the VP debate, and a month away from the General Election. See you then!


Post-convention, Pre-debate: State of the Race

donald-hillary-800

Didn’t they look so happy together? Ah, for the innocent days of 2005…

I haven’t written about the election for a while. Mostly I’ve been having a busy Summer, and trying to reserve my writing time to finish a screenplay I’ve been working on for a while so that I can get it out into the submission world, and free myself up for new writing projects.

But I’ve also refrained for the very good reason that pre-convention polls, and polls during the conventions, can be quite volatile. An event (A VP pick, an acceptance speech) cause a spike, that spike fades, and then- Bam!- it happens again. It isn’t until a few weeks after both conventions are over that you start to get a sense of how the race is settling out. So here we are, +3 weeks out from the end of the conventions. How do things look?

Clinton is still unprecedentedly unpopular for a major party nominee, with a net favorability rating of -11.5%:

favorable

You would normally associate this profile with the candidate who is going to lose the election. Except that you can see her convention did improve the outlook, and, most vitally, she’s running against a guy with a net -29% favorability rating:

favorable

Looking back over the last few elections, it’s almost a truism- the candidate with the higher favorability rating wins. And, indeed, if we look at the Real Clear Politics polling average for the period from when Trump de-facto secured his nomination after the Indiana primary through today, we see the following:

Tvc

This really isn’t very ambiguous. Except for a four-day period shortly after he’d secured his nomination and while she was still slugging it out with Bernie, and another four days immediately after his convention and before her’s, Clinton has solidly led Trump in an average of recent polls. We can also see that, whereas his convention bump almost immediately collapsed, she has consolidated and maintained the several points she gained during her’s.

One could counter that this is a two-candidate average, but this year The Libertarian and Green parties could both be a factor. It turns out not to matter, because looking at the three-candidate (Clinton-Johnson-Trump) and four-candidate (Clinton-Johnson-Stein-Trump) averages, both Clinton and Trump have lower totals, but the spread is about the same- around +6% Clinton vs. Trump. And it’s not total votes, but who has enough of a margin over the others to capture a state, that determines who wins the electoral college.

Speaking of which, here are RCP’s “Leaning” and “No Toss-up” maps:

lean

toss

Even excluding the swing states, Clinton wins the election. Including all current state margins, she wins it by a blow-out. It’s a very tough map for Trump because, not only would he have to win every swing state (including some that had formerly been shoo-ins for Republicans, like Arizona and Georgia), he’d also have to flip back at least one blue-leaning state.

Fivethirtyeight.com’s Polls-only model (which uses state and local polls, and runs regressions forward to election day) is predicting something almost identical:

polls-only

Their polls-plus model (which combines polling data with “fundamentals” indicators such as economic statistics) is a little more conservative about the size of the popular vote and electoral vote margins, but shows a similarly clear trend:

polls-plus

Huffpost’s Pollster, comes out with a similar result to 538’s “polls only”, forecasting an 8+% Clinton margin:

pollster

Meanwhile, 270towin.com uses the results of current state polls to run 10,000 electoral simulations a night. They have Clinton winning more than 90% of the simulations:

270

They haven’t had her below 80% at any time in the past few months:

tremds

The betting markets are on the same page:

predictwise

Finally, while it’s a weaker indicator than when the incumbent them self is running for election, Obama’s approval ratings also are on the side of a Democratic victory:

opop

So should the Democrat’s start popping champagne corks? Well, that’s never a good idea before the dust is settled.

Nobody as far behind as Trump is at this point has won in the post-war era. But this large a point difference has gone away before (so for example, someone ahead by 15% ended up at only 8% over). FiveThirtyEight has a good discussion of this. On the other hand, Trump has named someone as combative and extreme as himself as his new campaign manager after his third campaign shake-up, even friends and allies are questioning if he even wants to win, and the party establishment is seriously considering cutting all support for him and funneling their resources into trying to hang on to the Senate and prevent the now also-shakey House majority from eroding (see one of my favorite news aggregators with today’s headlines here).

I certainly know where my bet would lie, on the preponderance of all available indicators.


8 from 8: Things I’ve learned in eight years of submissions

eight

In mid-2008 I decided to get organized around what had until then been sporadic literary submissions. A color-coded Excel spreadsheet was born (of course). Over the years it grew to multiple tabs, and the 2008 tab tells me my first submission tracked there was June 26th, 2008. Since today is June 28, 2016, cursory mathematics indicates that I have been at this for eight years!

I aim for a submission a week. I’ve hit something like 70% of that target, racking up 297 total submissions. My stats (so far) are:

stats

Besides getting published, and having lots of fun with Excel along the way, I’ve learned some things. Here, for your perusal, are eight lessons I’ve learned in eight years of doing literary submission:

  1. There’s a lot of research involved. Not all journals are created equal- Some publish only a fraction of a percent of what they receive, and may not be worth your time, especially if you’re just starting out. Some have a reputation for being dynamic, others conservative and stodgy. Some have particular preferences for style & genre, or focus on a particular gender, geography, ethnicity, or subject. I needed to learn to pay attention to all of this in order to increase my odds.
  2. The process has its own rewards. There are many ways to go about this research. Duotrope can help. So can New Pages. Pay attention to where your writer friends are submitting. (If you don’t have writer friends, get some! Writing is a solo activity, which makes community even more invaluable.) When you see a bio of a newer writer you like, look at where they’re publishing. Flip through journals to see what you like. Subscribe to some, or read their online selections. After I’d done this kind of research a while, I started to see connections between my writing, others’, and the publishing world. Ideas about where to submit, and even what to write, bloomed.
  3. A rejection with content is worth its weight in gold. I’ve written about this before, but rejection is not the enemy. Form rejection, with absolutely no clue a human being actually read it, is. The vast majority of rejections I’ve received have been via form letters/e-mails. The rejections that mention something they liked or didn’t like, and maybe even have a suggestion or two, are totally welcome to me now. Both for their rarity, and the fact that they give me something I can use to improve.         
  4. You may never hear back from some places. If you look at my stats above, you’ll see that around 25% of my submissions are still pending. Some have been pending for years. I’m going to go out on a limb and say that, for example, the 25 submissions I still have pending from 2008-2010 probably aren’t going to get published. Some journals will tell you up front that they do not promise a response. Some don’t, and you won’t hear anything except the eerie whistling wind echoing through the dusty, abandoned caverns of the Internet…                                                                               
  5. Being asked to send something else doesn’t automatically mean you’ll get published. This one was a surprise to me. But, in fact, when I submitted something new to places that had passed on something earlier but said they liked it and wanted to see more, they more often than not didn’t publish my new submission. After editing at Mud Season Review, I have some sympathy for this. Whatever the intangible “it” was about the almost accepted piece, the next thing they send often doesn’t have it. Maybe the lesson for publishers is to take the first thing?                
  6. Having something accepted doesn’t automatically mean you’ll get published.
    This was even more surprising to me. But, things happen. Editors leave. Editorial schedules and directions change. Journals run out of funding for the planned issue. Or journals run out of funding, period. Which brings us to..
  7. If you keep at it, you’ll outlast some of them. More than once, I’ve had the experience of getting an e-mail (or even, in prior years, a letter) that turned out not to be an acceptance or a rejection. Instead, it was a journal announcing, regretfully, that they were hanging it up for one reason or another. It turns out it’s a tough gig for everyone, publishers and writers!                                                            
  8. It’s totally worth it. Somewhere in the midst of the vale of research, rejection, missing communications, vanished journals, etc., a real live publication happens. Then another. Eventually, you have an actual body of Published. Work. It’s not only gratifying to see yourself in print, it leads to connections with readers and writers that can be inspiring and rewarding. You have to submit to get there. It’s worth it!                   

So there are eight things I’ve learned in eight years. How about you? I’d love to hear from you about what you’ve learned from the submission process!