2023 was the 50th anniversary of hip hop, and in honor of this anniversary, the idea bloomed in my mind last year that I should review the top 50 albums of that 50 years. As I crunched together a list from various sources, 50 proved to be too restrictive- many of the classics were getting squeezed out. So, to make a little more room, I opted for 100 albums, two for each of hip hop’s 50 years. Due to some medical situations, I took a three+ month hiatus from blogging last year, so I didn’t finish the series. But I’m back at it, and I don’t mind extending into 2025 if you don’t!
For its formative years, hip hop was a live entertainment form, with the first recorded singles not emerging until 1979, and the first albums in 1980. So my review covers 1980-2023, with 50 posts of two albums each. The only ground rule I made for myself (besides looking for 2×50, aka 100, albums that were widely well-regarded) was that I had to have at least one from each year. As you’ll see by and by, some years get multiple albums, but since we have 100 spots for 43 years, it tends to all work out.
And with that, let’s embark on our next installment!
Dr. Dre, The Chronic(1992)– For his debut solo album, N.W.A. co-founder and producer extraordinaire Dr. Dre pulled out all the stops. There is no denying this album’s quality and influence- it almost single-handedly introduced the G-funk musical style of minimal (and retro funk) sampling, laid back grooves, live bass and guitar, and squelchy synths that would dominate a good chunk of 90s hip hop. It commercially established Death Row Records when it went triple platinum, and launched the careers of Snoop Dogg, Nate Dogg, and Warren G. And it remains a consistent pick among both artists and critics as one of the best (and best produced) hip hop albums ever. There’s also no denying that the album is thick with misogyny and glorification of violence. It’s true that this isn’t the only mode- there’s also a lot of humor, and post-L.A. riots tracks that rival anything Public Enemy did in terms of sharp and furious social/political critique. But it can still be hard to listen to without getting a little morally queasy. After all the hue and cry though, and despite my qualms, as an album it’s masterful. It has a narrative frame holding the whole thing together, musically it grooves, swings, and surprises, it’s alternately menacing and hilarious, and there isn’t a track that sounds out of place or lets you down.
Pete Rock & CL Smooth, Mecca and the Soul Brother(1992)- Whatever I listened to after The Chronic was going to have a tough act to follow, and I wasn’t familiar with this album at all beyond the track “They Reminisce Over You (T.R.O.Y.)”. But, with the quiet spiritual incantation that opens the first track, and the hard metallic beats and jazz samples it slides into from there, I was immediately in. The debut album from New York duo Pete Rock and CL Smooth is definitely working in a recognizable groove- sophisticated East Coast conscious hip hop circa early 90s- and perhaps doesn’t do a lot new or different with it. But it’s a favorite groove of mine! And, if one could often wonder if G-funk is furious at, or in love with, the problems of the neighborhoods it rose from, this album is unambiguous about (as one track puts it) escaping from “The Ghetto of the Mind”.
If you’re curious about the sources I used to compile my list, you can check them out here:
Finally, if you’d like a playlist for the entire list, you can find that here. Listen to it sequentially for the historical development of the genre, or play on shuffle for maximum historical scramble!
Last year was the 50th anniversary of hip hop, and in honor of this anniversary, the idea bloomed in my mind that I should review the top 50 albums of that 50 years. As I crunched together a list from various sources, 50 proved to be too restrictive- many of the classics were getting squeezed out. So, to make a little more room, I opted for 100 albums, two for each of hip hop’s 50 years.
For its formative years, hip hop was a live entertainment form, with the first recorded singles not emerging until 1979, and the first albums in 1980. So my review will cover 1980-2023, with 50 posts of two albums each. The only ground rule I made for myself (besides looking for 2×50, aka 100, albums that were widely well-regarded) was that I had to have at least one from each year. As you’ll see by and by, some years get multiple albums, but since we have 100 spots for 43 years, it tends to all work out.
*June 2024 addendum: Due to some medical situations, I took a three+ month hiatus from blogging. It’s unlikely I’ll finish this series this year. But I’m back at it, and I won’t mind extending into 2025 if you don’t!*
And with that, let’s embark on our next installment!
A Tribe Called Quest, The Low End Theory(1991)– They weren’t the first to do this, in fact we’ve had several examples so far in this list, but this album is a whole new level of jazz sample-fueled hip hop. More than that, it consciously seeks to link the genre to the larger history of Afrocentrism and Black music in America, and to use that history to critique the ways the contemporary industry isn’t measuring up to the social and political legacy of the music. All of that might be a bit heavy, except it’s delivered with such an innovative music mix, and poetic and quirky flow and rhyme. In other words, this album overflows with the energy and positive power of the conscious hip hop of the nineties. Formed by a circle of high school friends from Queens, A Tribe Called Quest were co-founders of the Native Tongues Collective with Jungle Brothers, De La Soul, Queen Latifah, and Monie Love. They went into this, their second album, with group MC Phife Dawg’s recent diagnosis of diabetes leaving him and fellow member/rapper/producer Q-Tip determined to make something beyond what they’d previously done, which led them to focus on the “low end” of the status of Black men and the bass end of music. The results speak for themselves, with an album that was their commercial breakthrough, a long term critical favorite, and an ongoing influence on the next generation of hip hop artists and producers. As for me, this genre of hip hop was my jam in the nineties. Listening to it now, there’s certainly an element of familiarity and nostalgia, but the energy, innovation, and downright fun is as fresh as ever.
Ice Cube, Death Certificate (1991)- It’s interesting that these two albums ended up together in post order, because this might very well be the yang to the yin of the prior selection. In all kinds of ways- the anger in the flow, the hard and dense mix, the lyrics sketching out the darkest sides of street life. But as is true of all yins and yangs, you can also see the inextricable link between the two. Both are founded on response to the frustration of the Black American experience, both are musically innovative while hearkening back to cultural heritage (jazz for A Tribe Called Quest, 70s funk and soul for Ice Cube), and both deliver their message with humor and artistic ambition. In Death Certificate‘s case, the very structure shows the intent to aim for statement, with a “death” side stating the problems of contemporary life, followed by a “life” side describing his vision of where things need to go, and intros/outros and sketch sections holding the whole thing together. So, despite personifying two nineties sub-genres that seem diametrically opposed musically and thematically- alternative/conscious hip hop and gangsta/g-funk hip hop- the aims and the means of these two albums are not so different. This is not to excuse the racialism, homophobia, and misogyny of Ice Cube’s lyrics so often on display here, that all deserves criticism. But I can see how much more crafted and ambitious this is than his previous album, AmeriKKKa’s Most Wanted, how much of the West Coast nineties sound it anticipates, and understand how it ended up on so many “best” lists.
If you’re curious about the sources I used to compile my list, you can check them out here:
Finally, if you’d like a playlist for the entire list, you can find that here. Listen to it sequentially for the historical development of the genre, or play on shuffle for maximum historical scramble!
As I’m sitting down to write this Sunday night, there are about 35 hours until polls open. If you’re reading it Monday, it’s less than 24! So here we are, at our last update before the election itself. What does the semi-final picture look like?
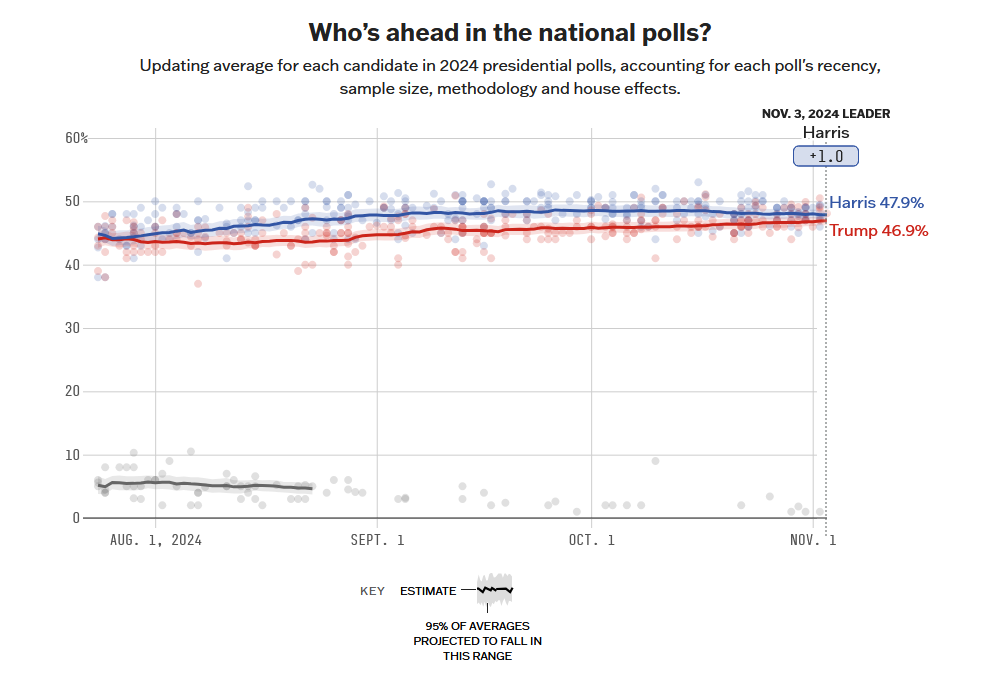
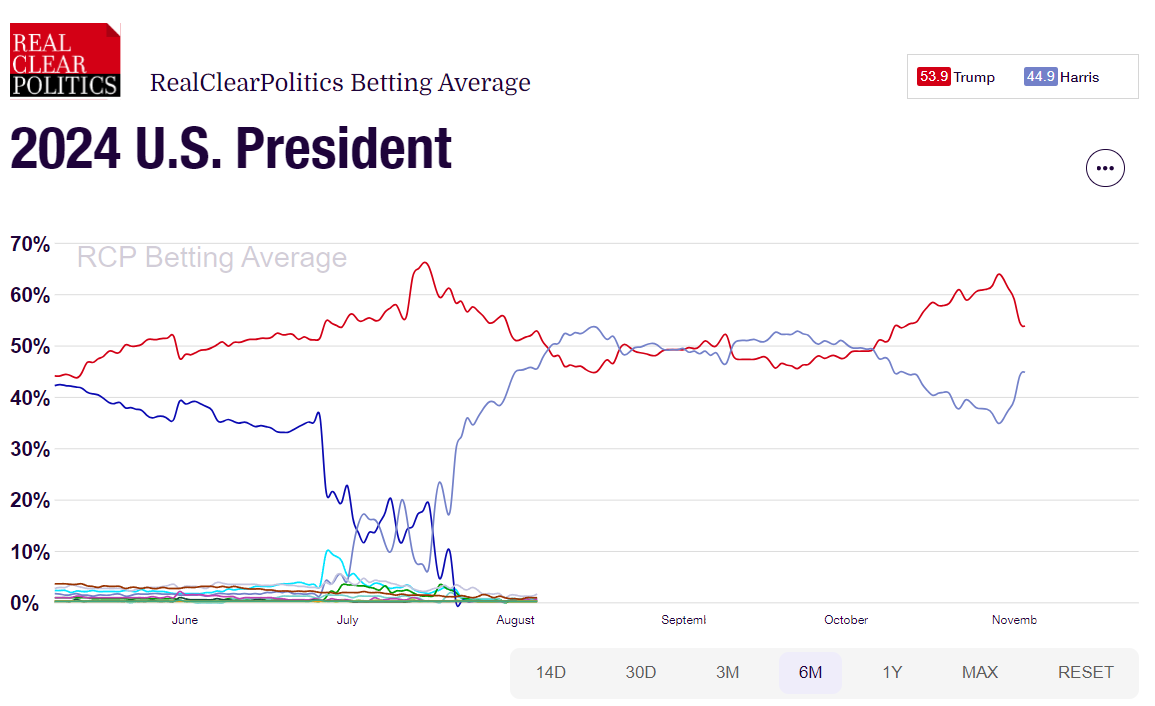
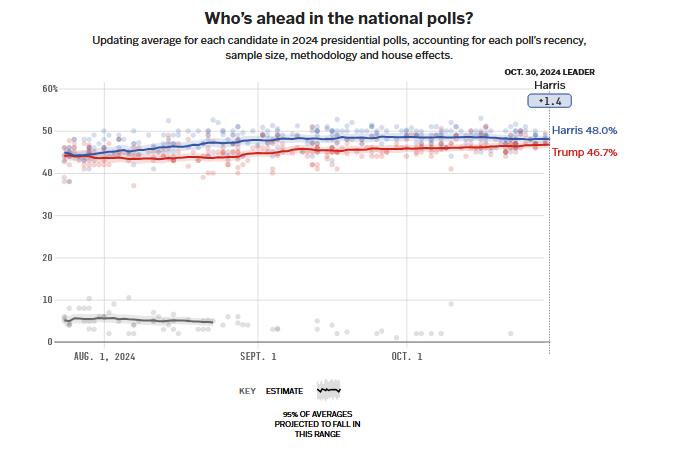
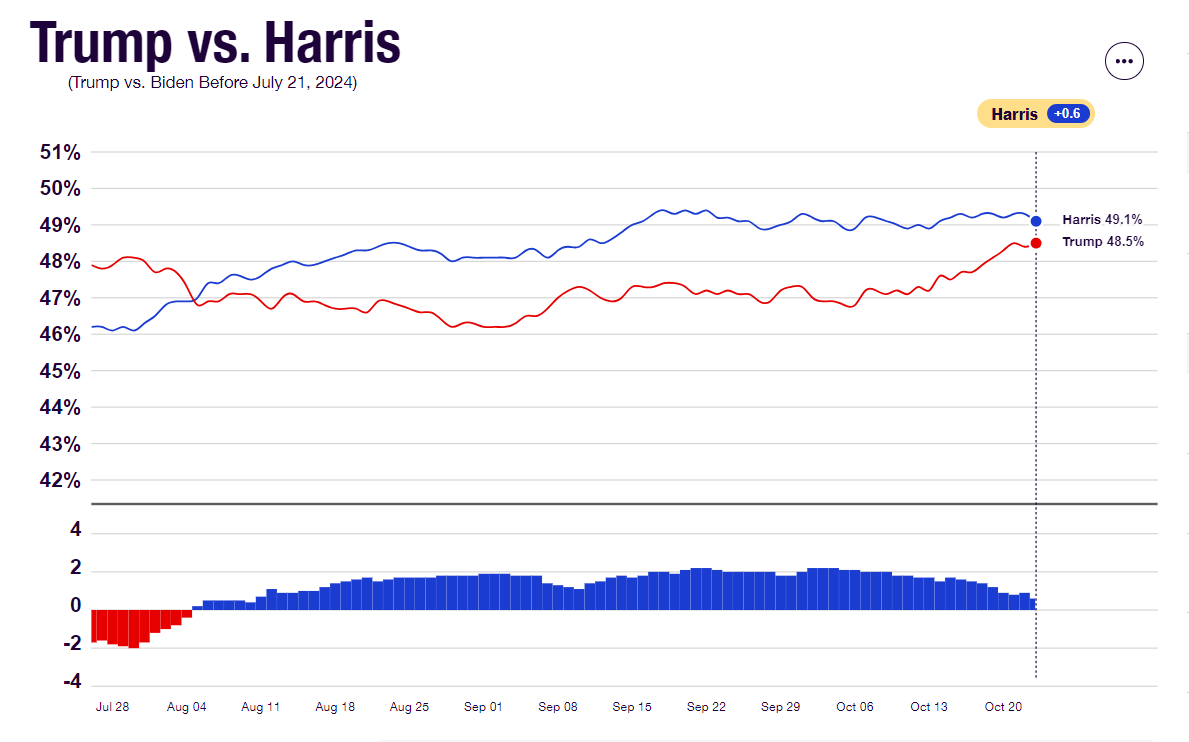
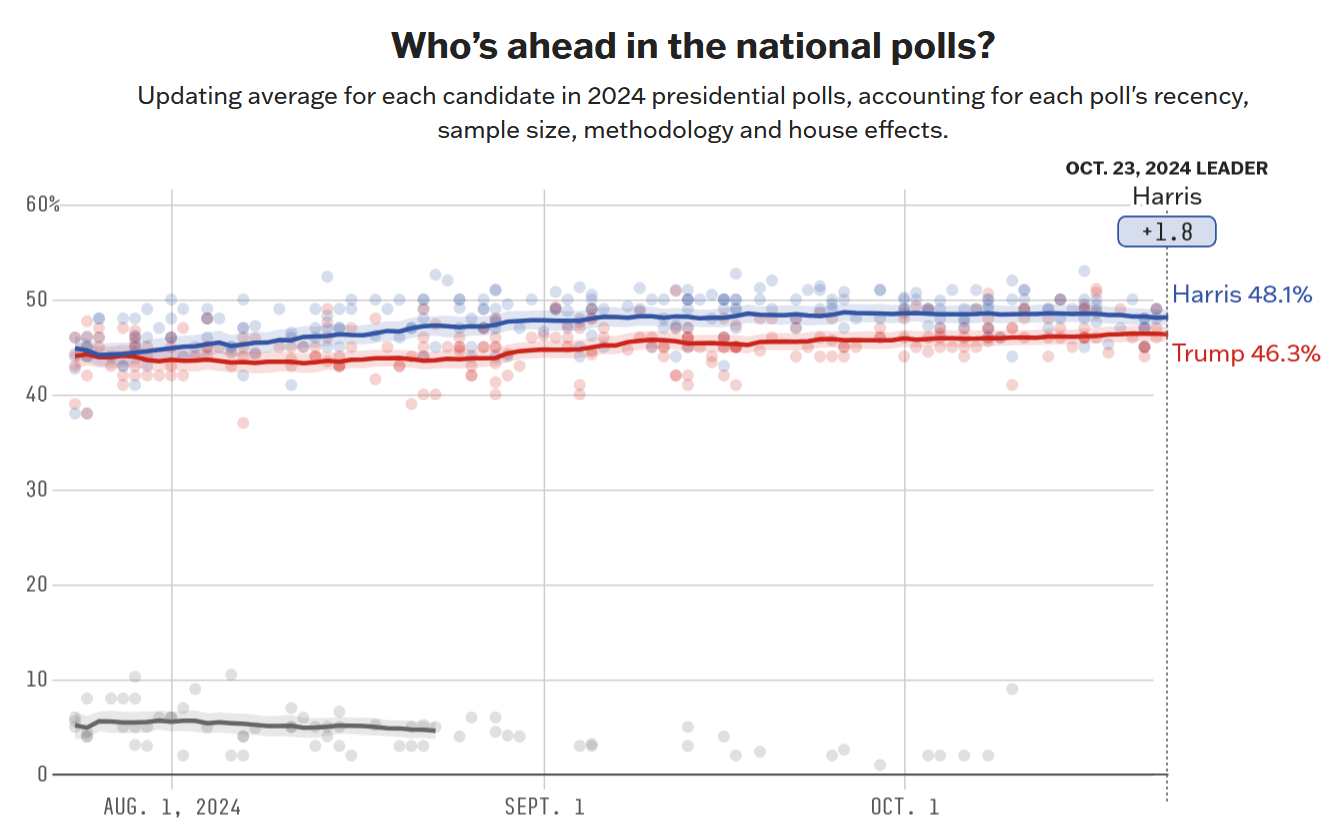
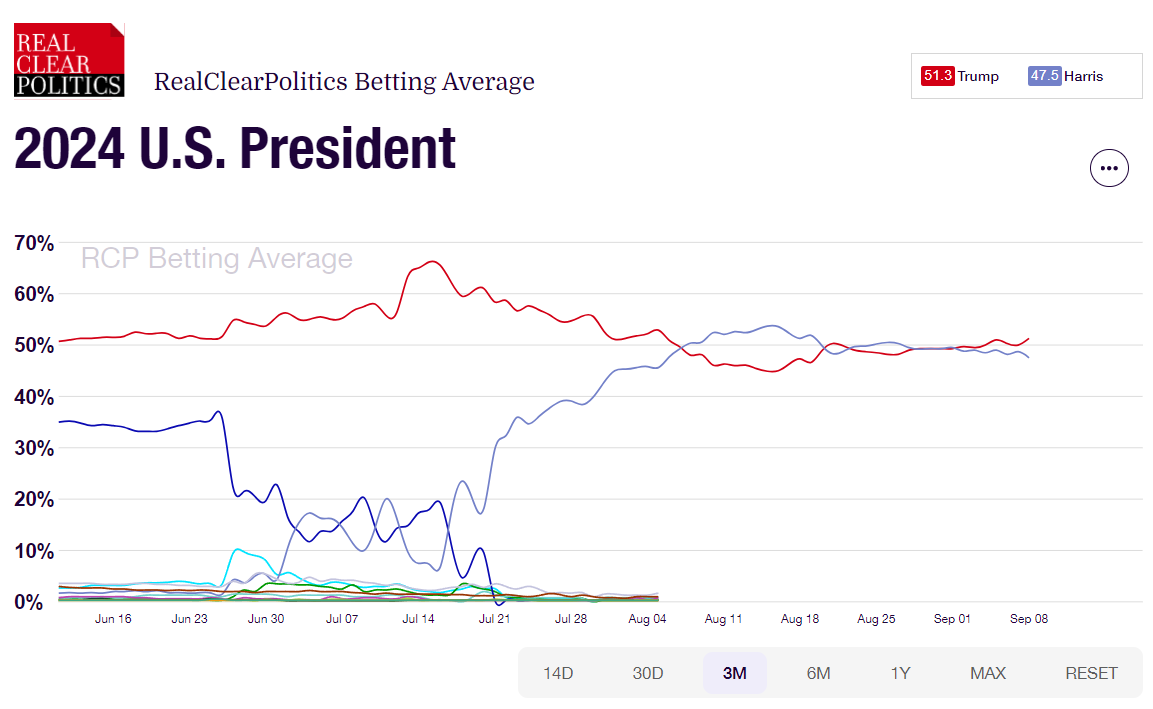
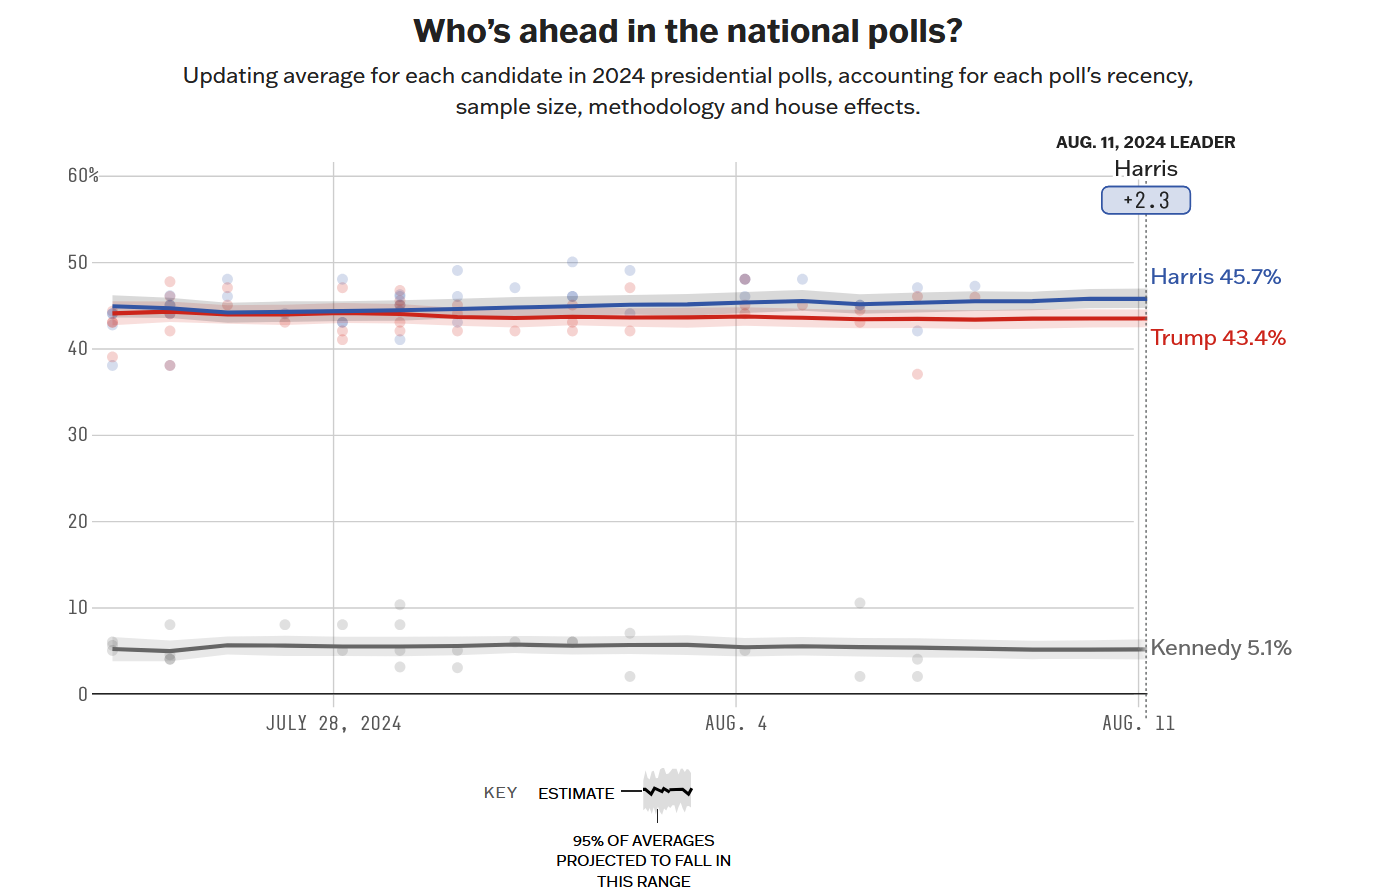
Trump’s lead in the RealClearPolitics poll average has narrowed over the last four days from 0.4% to 0.1%. Over at 538, with it’s more rigorous methodology of weighting polls according to the pollster’s track record of reliability and partisan tilt, Harris remains ahead, but her lead is down from 1.4% to 1% over the past four days:
That’s a bit of a mixed picture. It’s also well within the standard polling error of +/-3%. The other thing we can observe is that the 538 Harris lead is below the point- somewhere in the neighborhood of 2% to 3%- where a Democratic national lead doesn’t necessarily translate into an Electoral College lead. But, between the margin of error and the unknowns of how late deciders will break (the last two elections they have gone disproportionately to Trump, but there have been many other elections where they break toward the Democratic candidate, or go roughly equally to both sides) she definitely could get there.
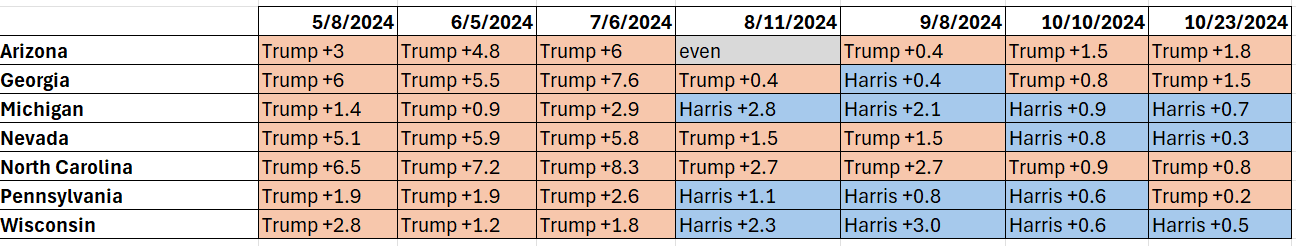
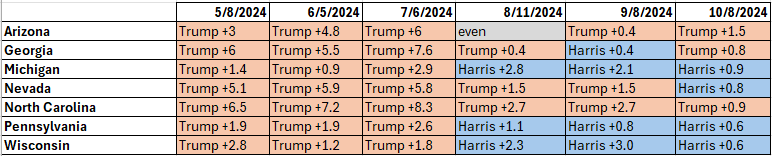
Can we get a clearer picture by looking at the states? For the 7 swing states, RCP continues to show Trump leading in 5 of 7 states. 538, with it’s more reliable methodology, now shows the same, with Nevada going from a tie four days ago to a 0.4% Trump lead. Other than that, it’s also a scattered picture- Trump’s leads in Arizona and North Carolina are up from four days ago, his leads in Georgia and Pennsylvania are down, and Harris has bumped up slightly in Wisconsin and down slightly in Michigan. All of these changes are so small though that they could be statistical noise. And, crucially, every swing state margin remains less than the polls margins of error, and the same 4 of 7 states from four days ago remain separated by less than 1%:
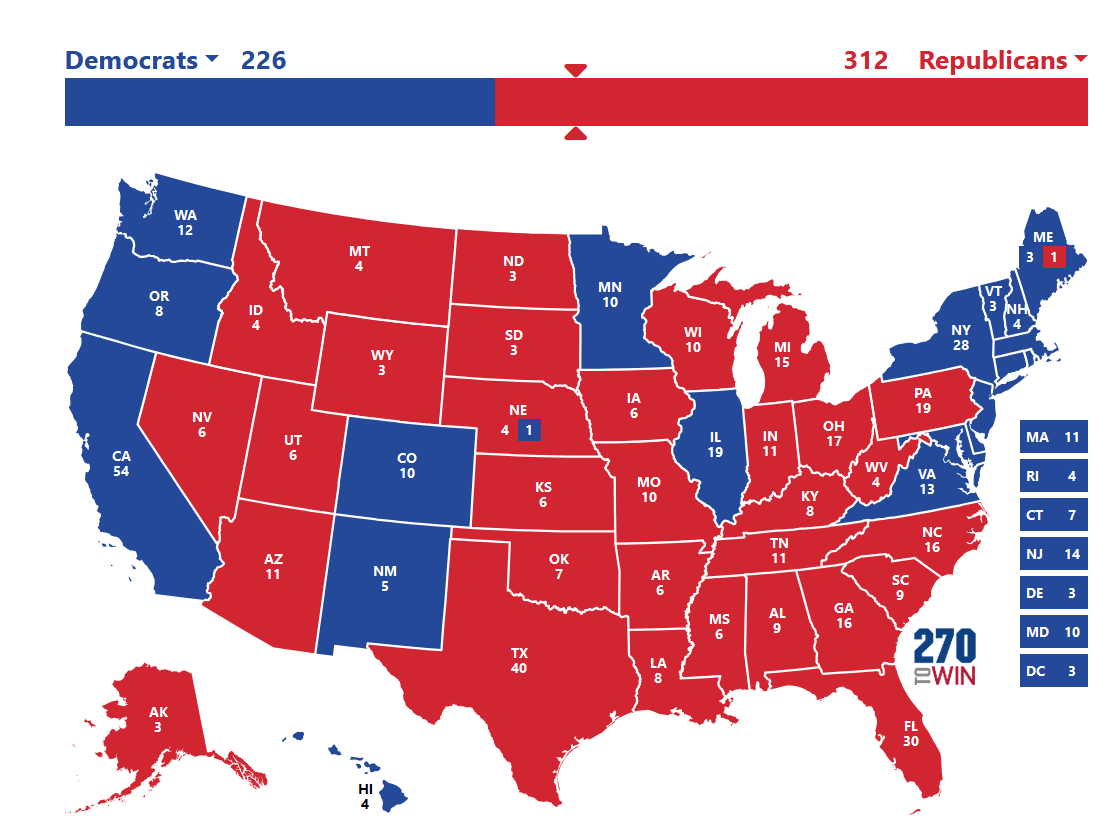
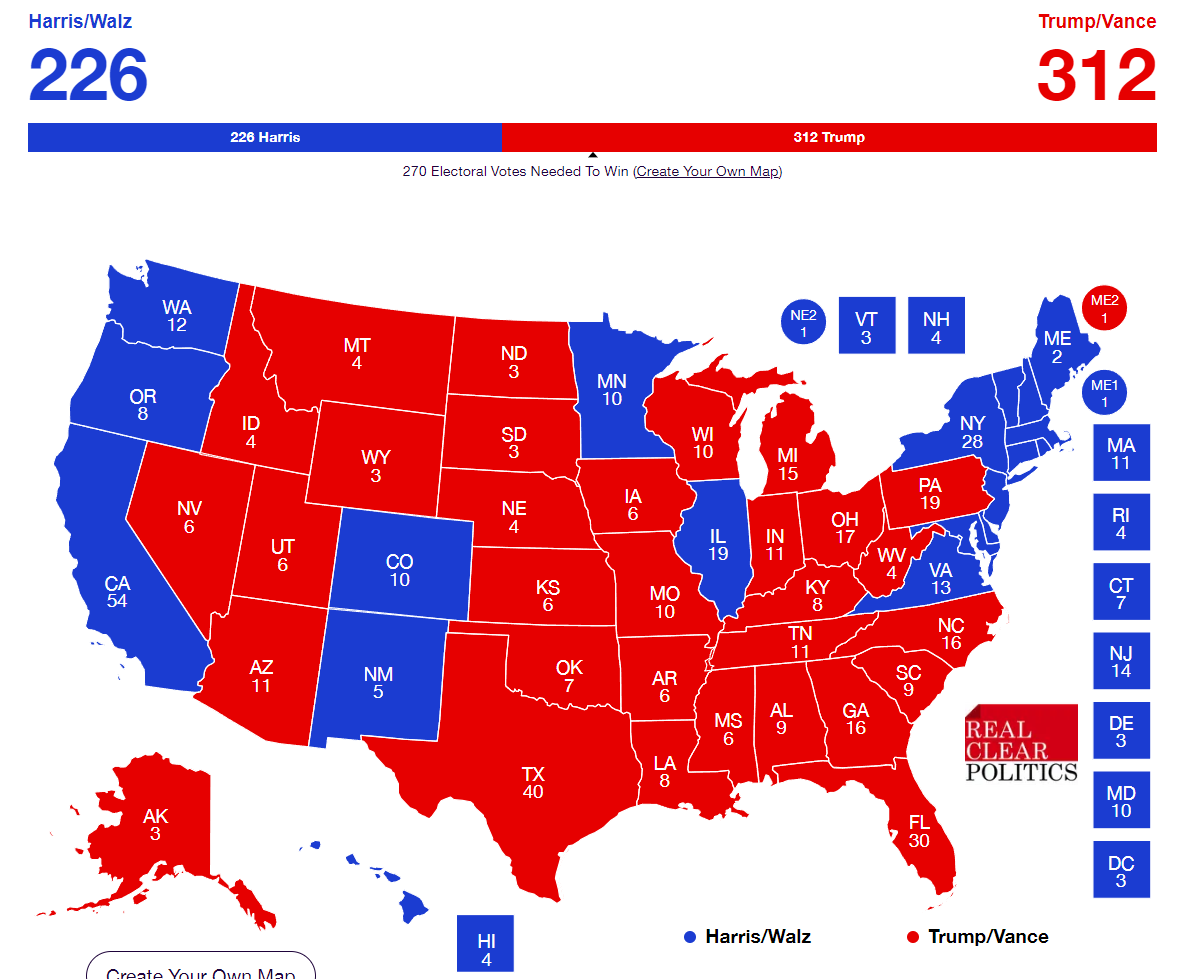
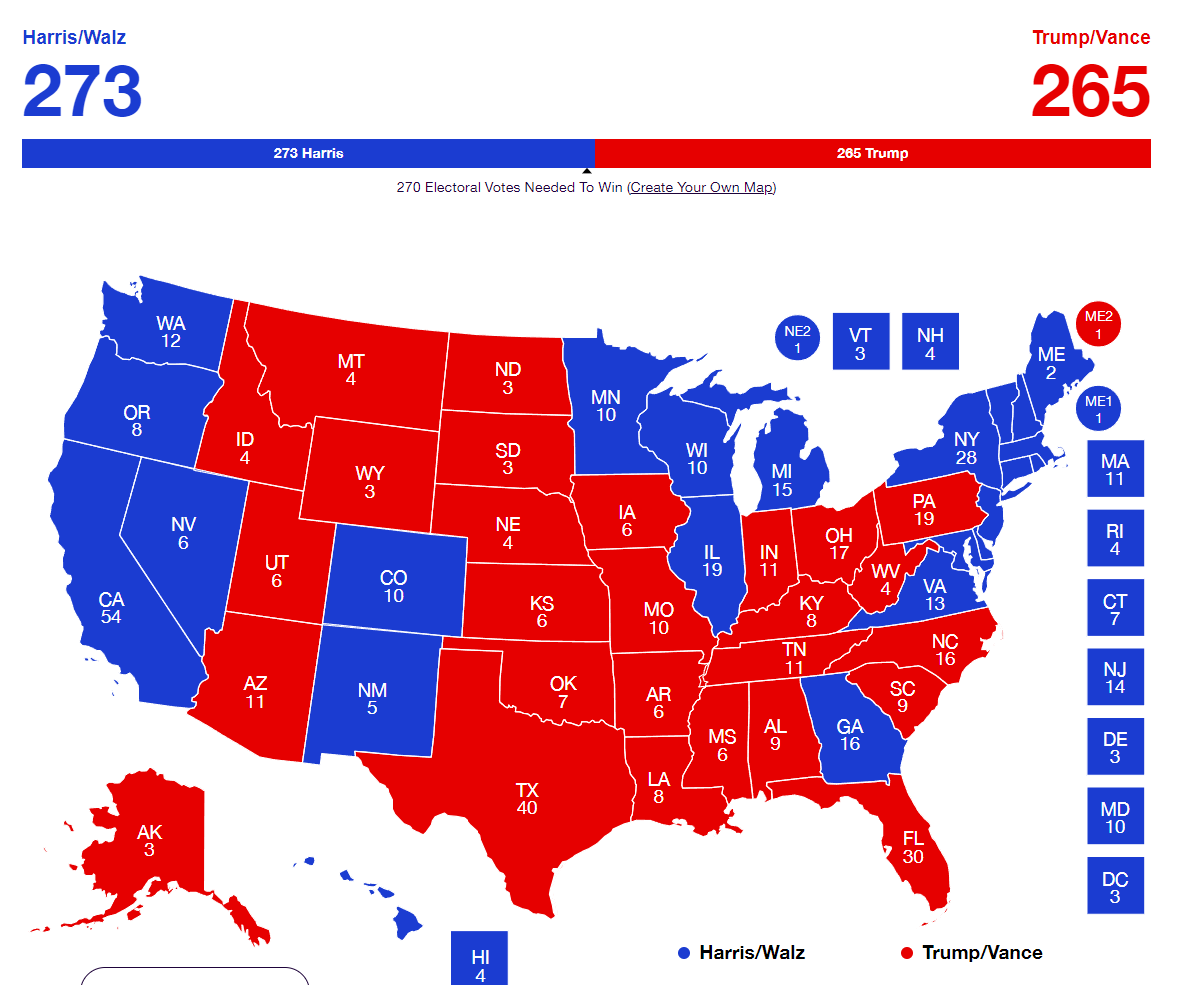
So what does that add up to? RCP still has the same map as four days ago (but note that their Pennsylvania average only has Trump ahead there by 0.3%, so if that state changed it would flip things to 270-268):
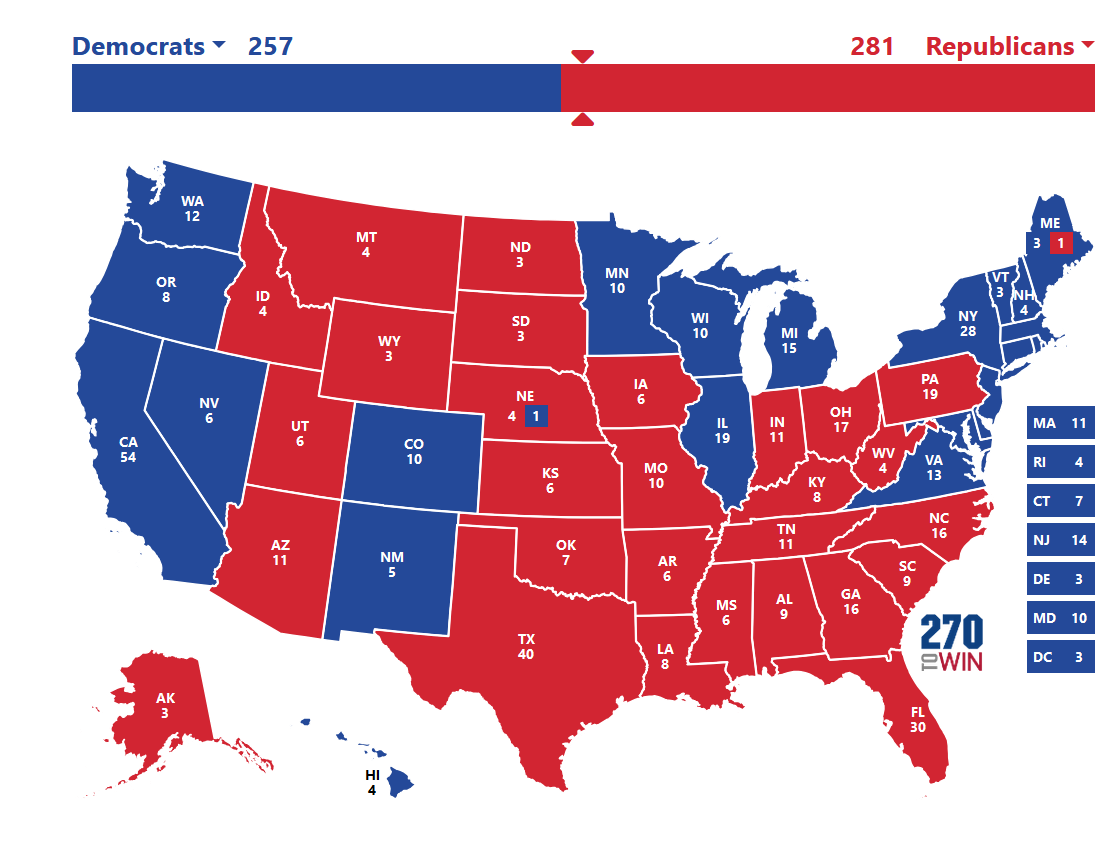
538’s state polls now would result in the same electoral map as above, with the exact same Pennsylvania proviso as above (their average only has Trump ahead by 0.2% in Pennsylvania).
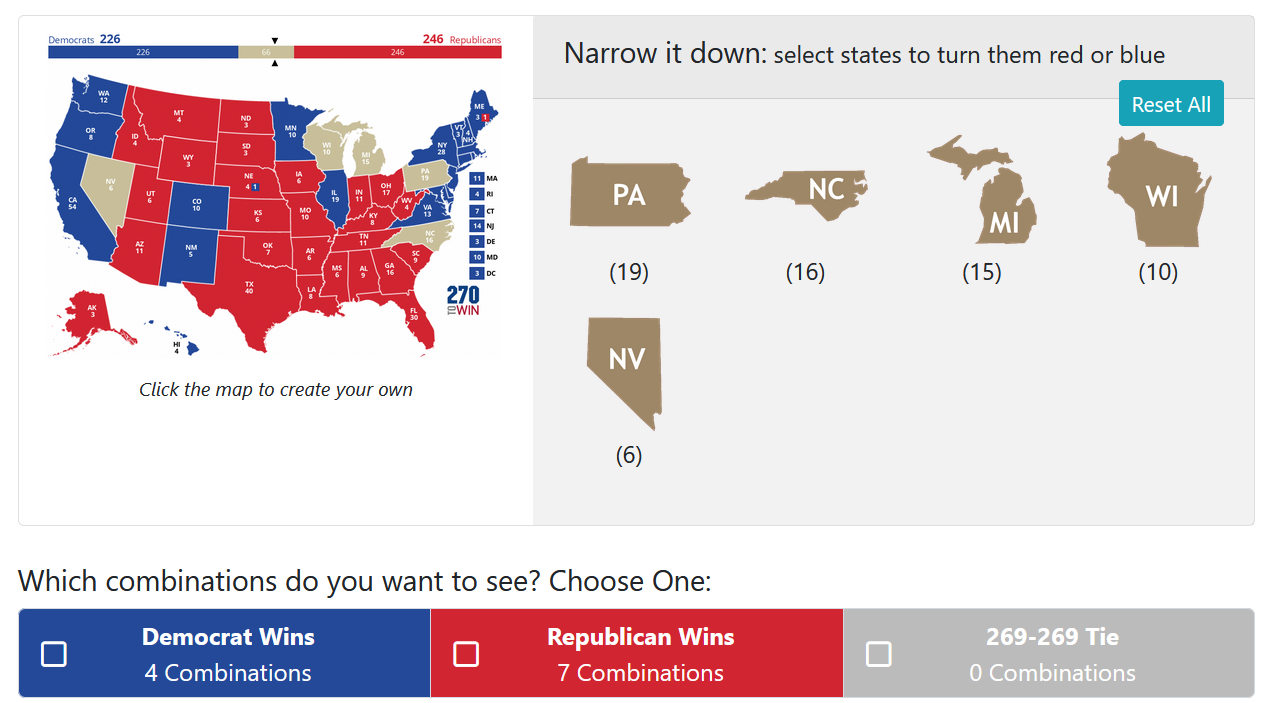
And so, what was true four days ago remains true- with four states separated by less than 1%, and all seven below the margin of error, it wouldn’t be a major surprise to see either candidate win any given state. It would even be consistent with these numbers to see either Harris or Trump win all seven. It’s one thing to say that, but visually it’s kind of startling when you realize that both these outcomes would be entirely consistent with current polling:
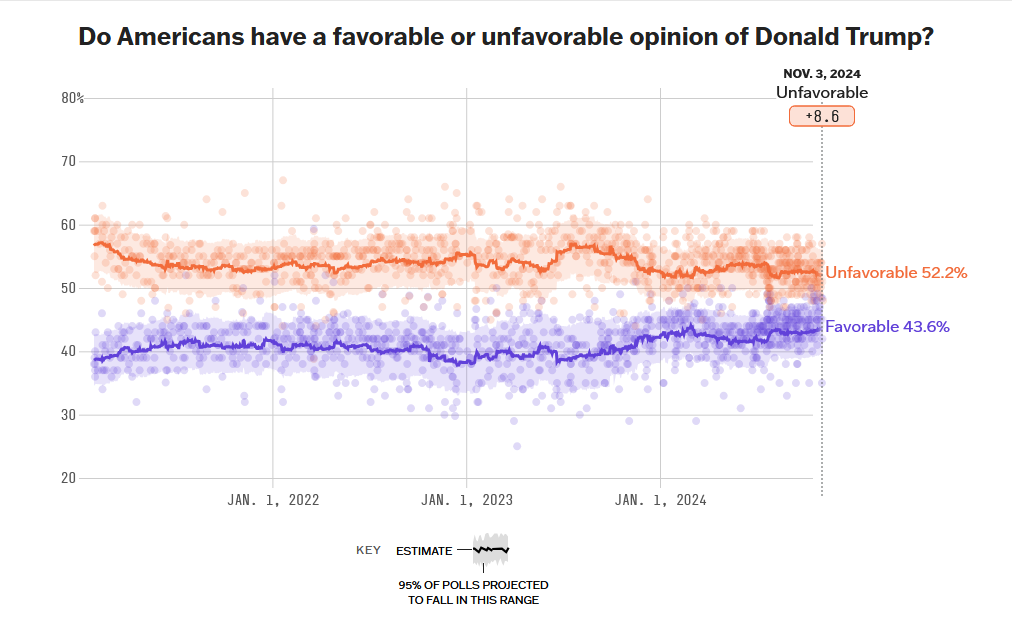
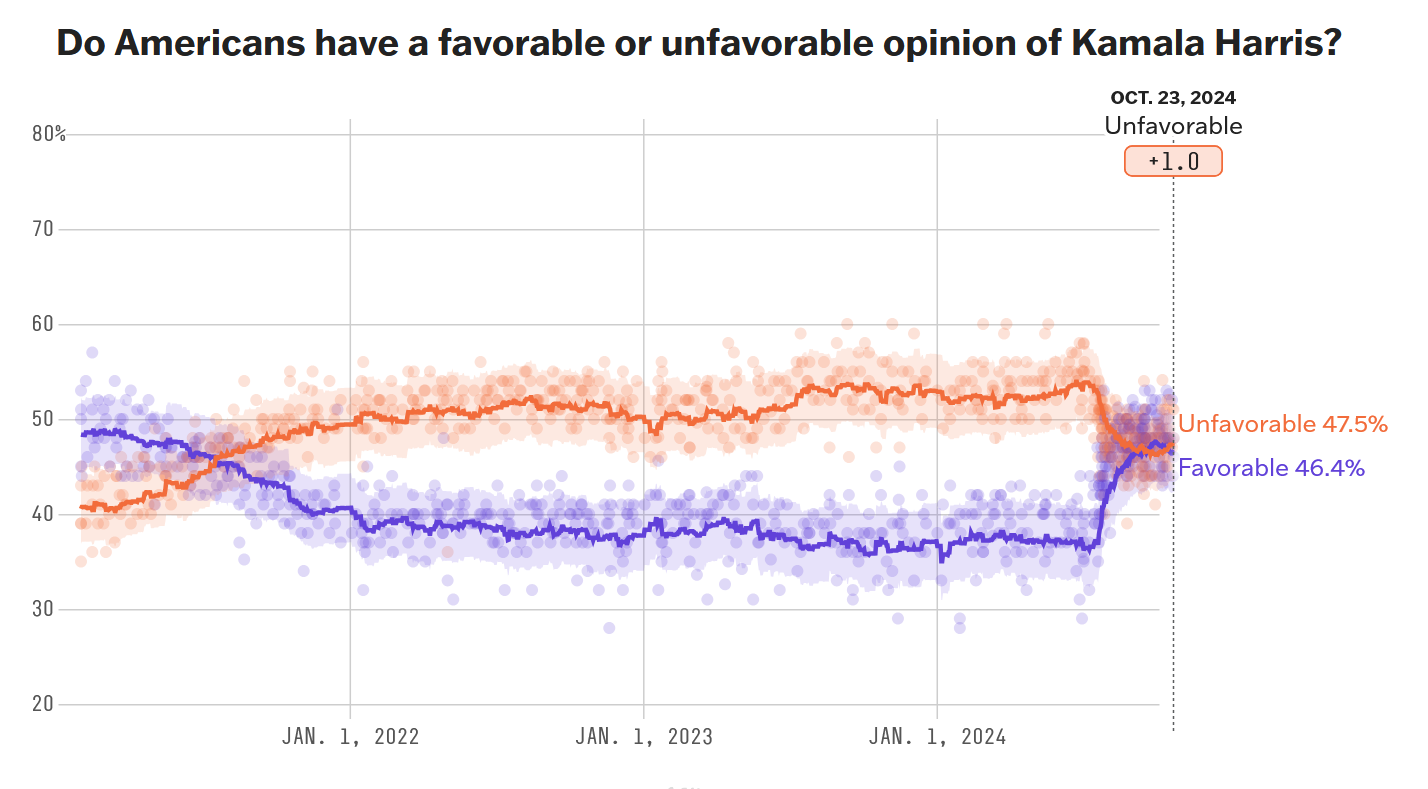
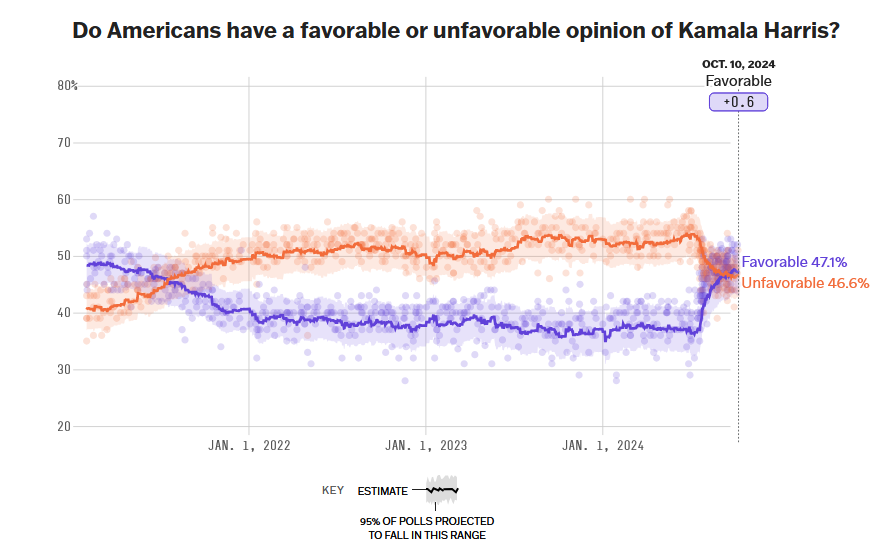
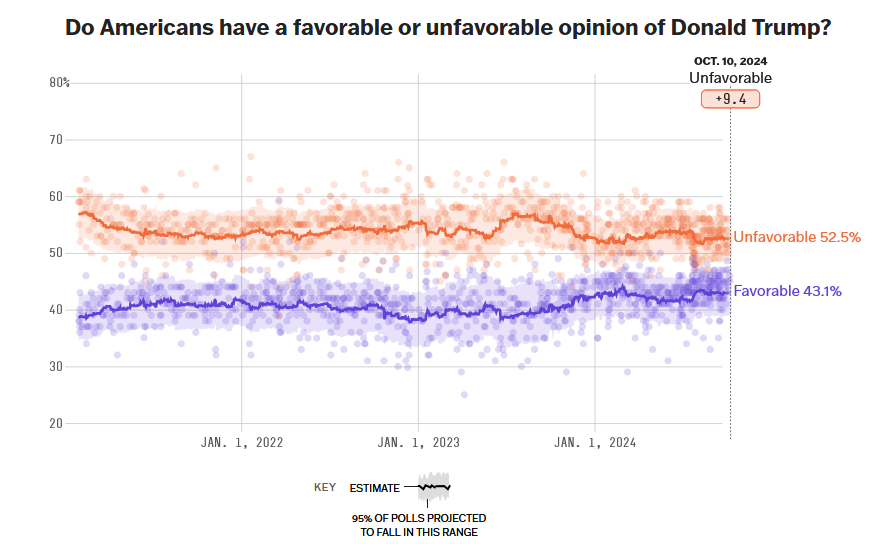
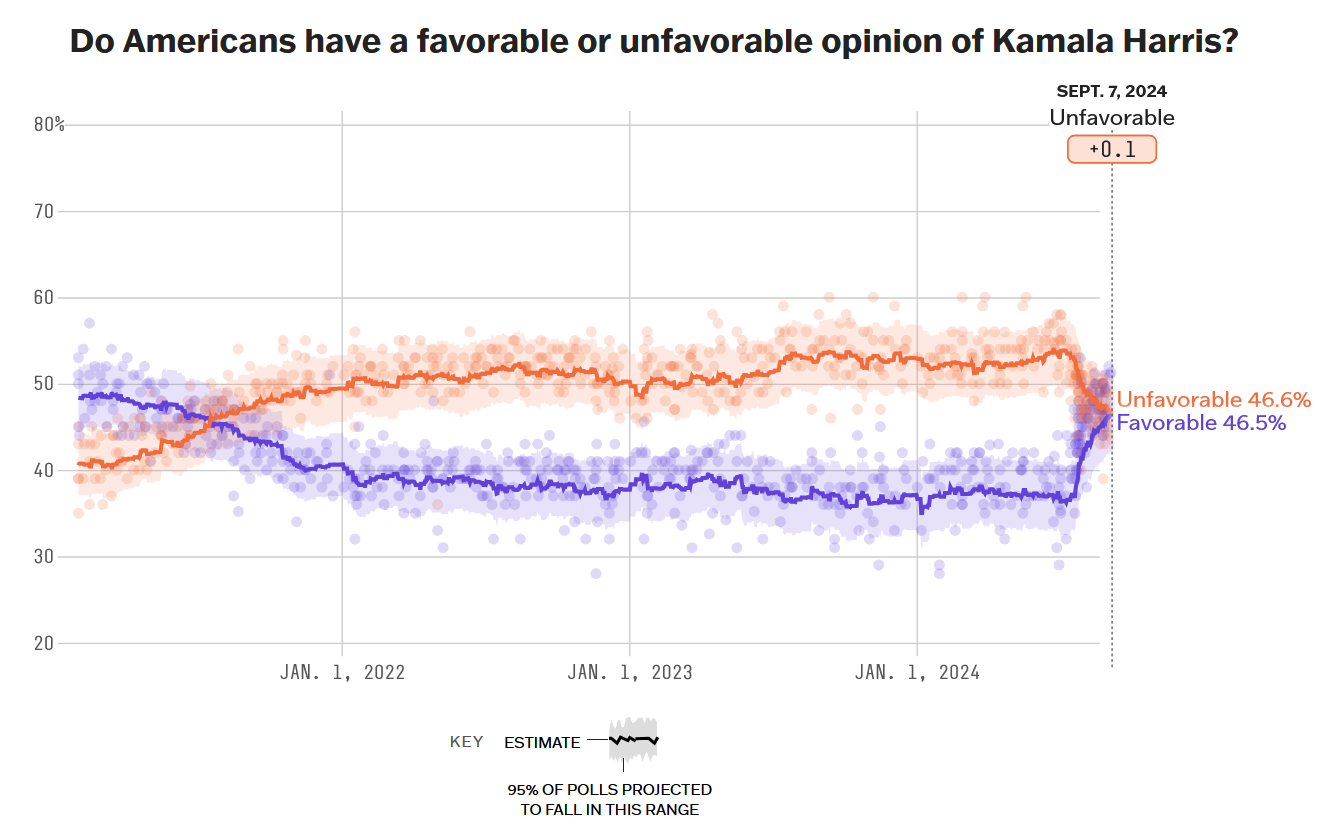
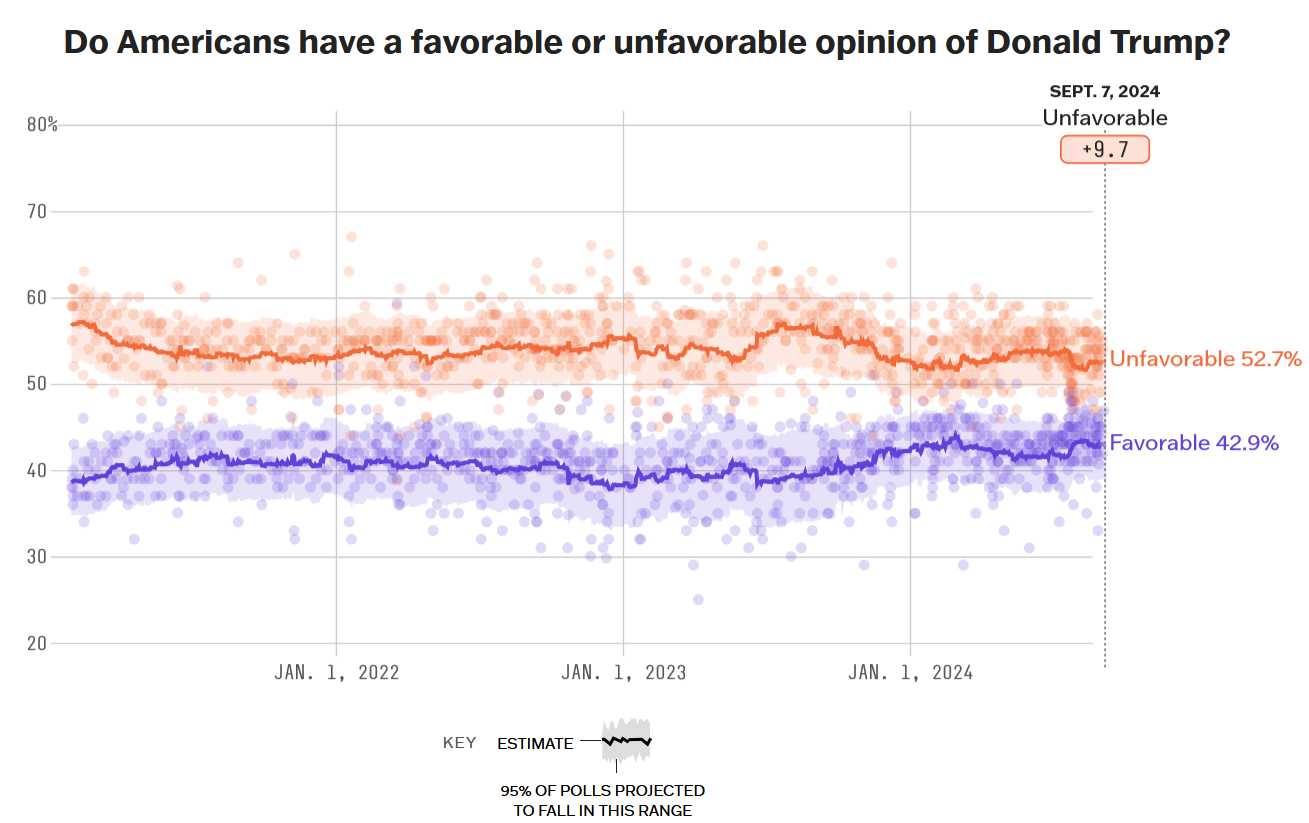
Approval ratings, which are another kind of stand in for preference, still show an edge for Harris, but her net negatives have grown from 1.5% four days ago to 2% today, while Trump’s net negative has improved by 0.4%. Still advantage Harris, but getting to the point where it’s not really a meaningful difference:
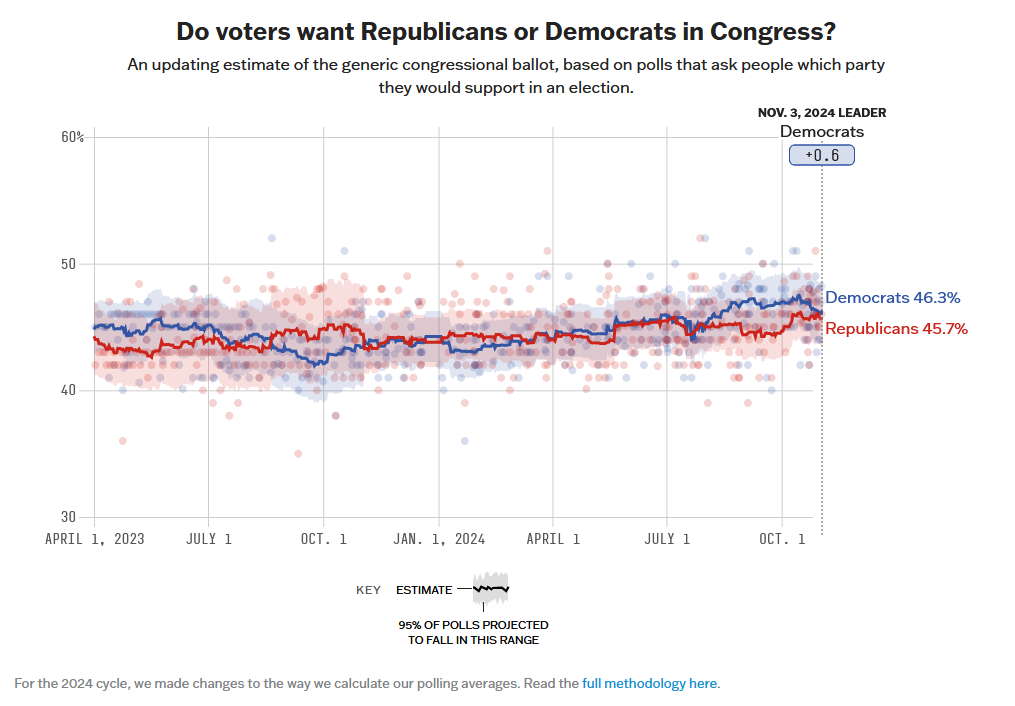
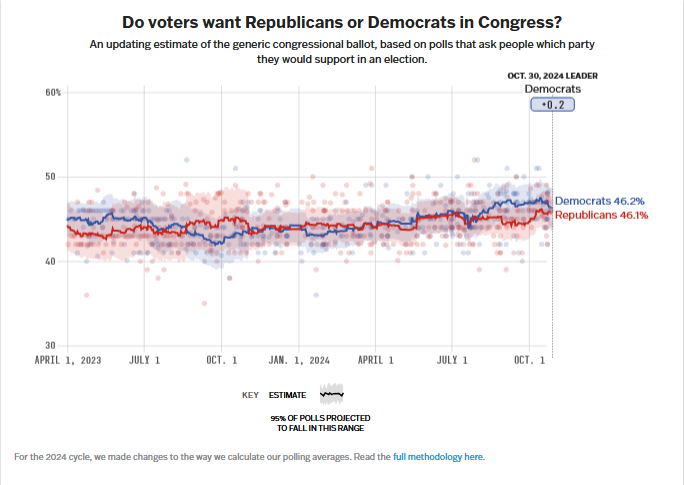
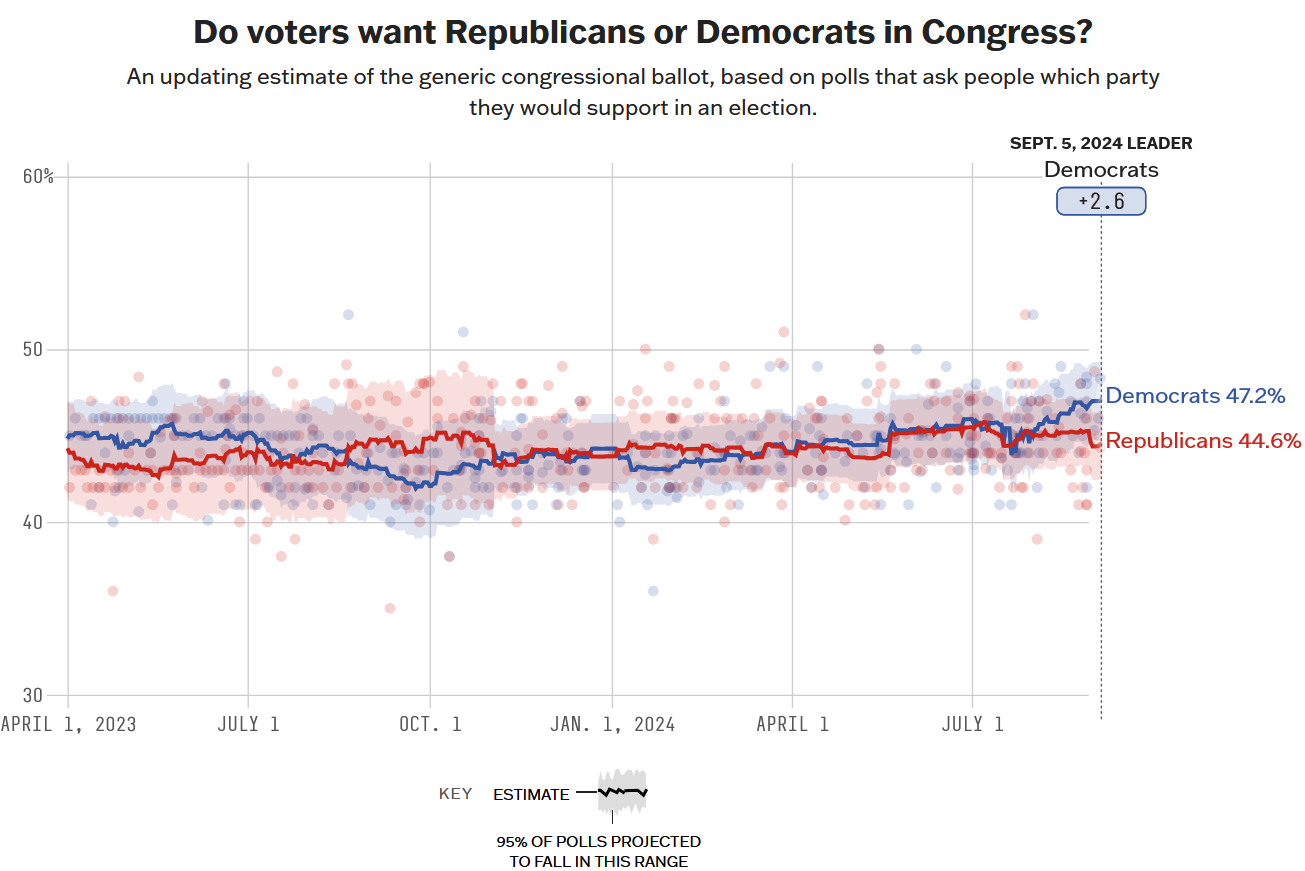
In some good news for Democrats as a whole, their Congressional preference edge has expanded a little from four days ago:
No change in this, but a significant indication of overall strength for Democrats remains that, through 100 special elections over the past two years, the party has outperformed by an average of 6% against the partisan lean of the races in question (per a spreadsheet compiled by Nathaniel Rakich of 538):
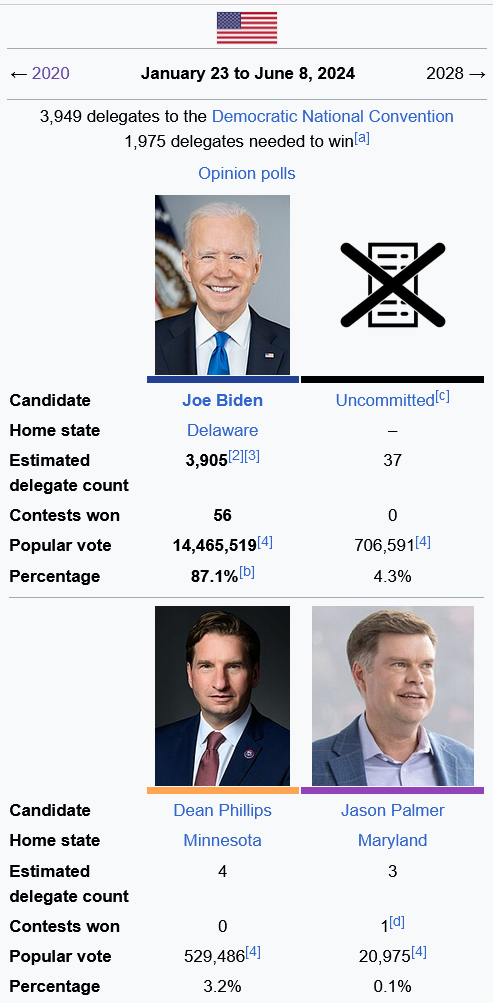
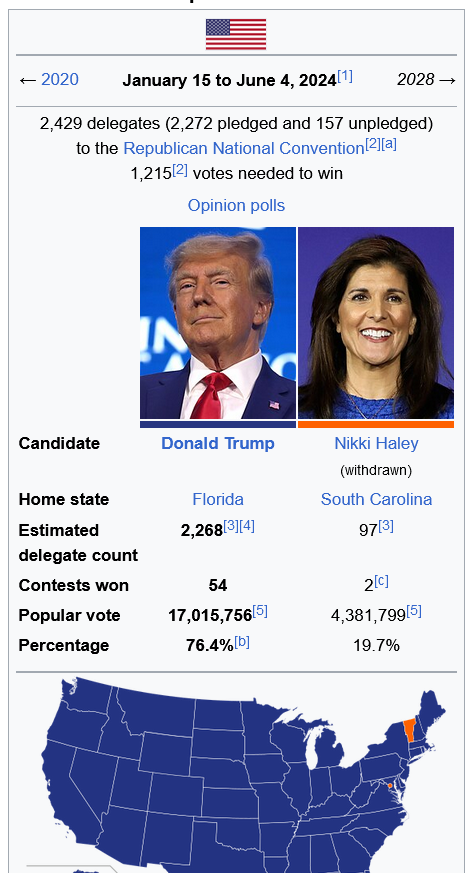
There’s also no change in this indicator, but it remains true that Biden’s percentage in Democratic primaries was ahead of Trump’s in Republican primaries, indicating that Republicans had comparatively more wavering partisan supporters to bring home for their nominee:
The one thing that has really shifted over the last four days is the betting markets, where Trump’s chances went down by 10% and Harris’s correspondingly rose. I think they spotted the arbitrage exposure I talked about in the last post and are hedging their bets (every pun intended):
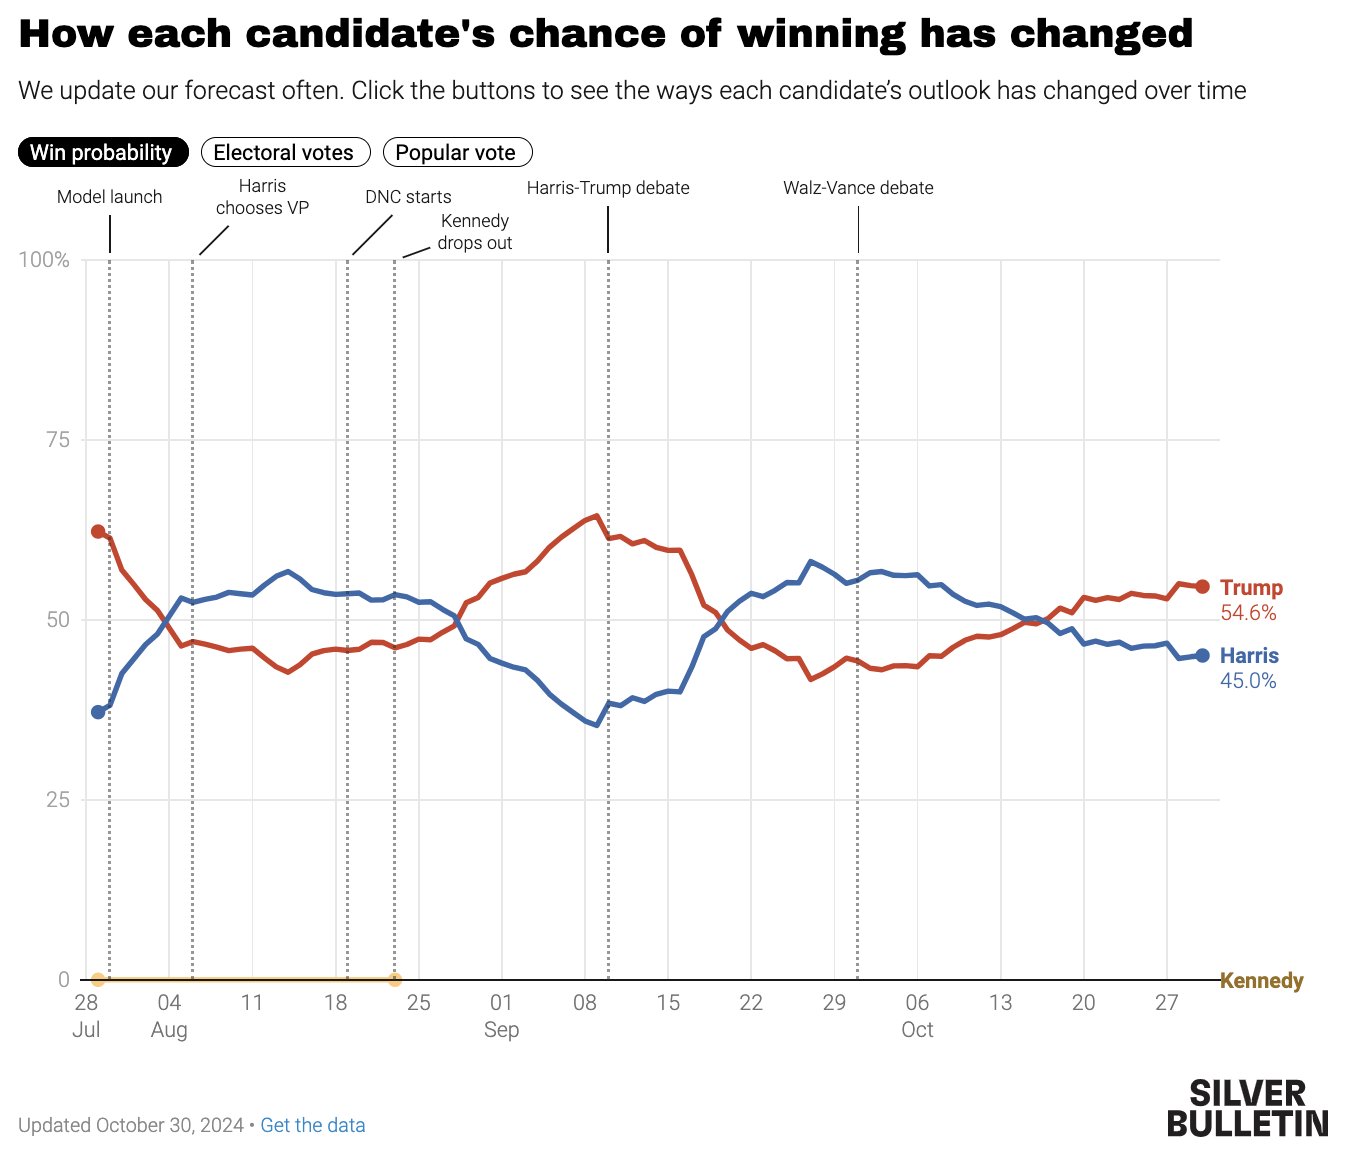
Perhaps unsurprisingly, the numbers the betting markets are converging on are pretty close to where the forecast modelers have ended up. 538’s forecast model is not far off from 50/50:
And 538’s now solo founder Nate Silver, who has his model behind a paywall but gives frequent updates, is even closer to 50/50:
We talked four days ago about doing a map that leaves blank the four states that are within 1%. Since those states haven’t changed, the results are the same- there is one path by which Harris could get there, winning all three of Michigan, Pennsylvania, and Wisconsin. Trump would win with any one of the three:
This is probably a good place to remind ourselves of something both 538 and Silver repeat often, that just because the forecast models are close, it doesn’t mean the outcome will be. To understand why, a quick look at the 538 model’s results is helpful. Though the overall distribution of outcomes equates to a 53% chance of Trump winning, the single most common way he does it in 1,000 runs of the model is to win all seven swing states (the big red spike on the right). Similarly, Harris has an aggregate 46% chance of winning over 1,000 runs of the model. But she’s as likely to do it with 286, 308 or 319 electoral votes as she is to squeak by (the four highest blue spikes on the left):
Overall, looking at the indicators, it feels to me like a just about even mix of signs of closing momentum towards Harris and Trump. As mentioned last time, there are some reasons to think that things could be better for Harris than the polls indicate:
In 100 special elections over the past two years, Democrats have consistently done better by several percentage points than the dynamics of the races would indicate.
Harris is running behind Democratic Senate candidates in several swing states and, other things being equal, it would be surprising if her numbers didn’t end up equalizing a little more there.
Democratic voters show an enthusiasm edge over Republican voters in recent surveys (which is usually, but not always, correlated with turnout).
As might be expected from the item above, there is every sign that the Democrats have a stronger ground game in this campaign (things like number of field offices, volunteers making calls and knocking on doors, turnout for rallies, etc.).
Pollsters may have bent over backwards to correct the sampling models that had them systemically underestimating Trump supporters in 2016 and 2020, and may now be systemically underestimating Harris’s support.
And, in a possible indication of this, the uncannily accurate Ann Selzer released her final Iowa poll over the weekend, and it showed Harris ahead there by 4%. The point is not that she will or won’t win Iowa, but if she really is doing much better there than expected, she’s probably doing much better in lots of places.
These are all logical takes, supported by empirical data, but the logic here cuts both ways. If polls are underestimating Harris by a few percent, she could be headed for a comfortable win. On the other hand, if they’re still underestimating Trump the way they did the last two cycles, he could be headed for a blowout. Or, things could be exactly as they appear, and a handful of votes in a few key states (with Pennsylvania being the most likely tipping point) could see either candidate squeak by.
My best advice remains what it was four days ago- follow some of the most empirically grounded commentators on the lead-up to election night (and on election night itself). Axios had a good round-up of suggested follows:
“Pick a few trustworthy accounts rather than gorging on whatever pops up.
Jon Ralston (@RalstonReports) is your man in Nevada … Garrett Archer (@Garrett_Archer) in Arizona … Greg Bluestein (@bluestein) and the Atlanta Journal-Constitution crew in Georgia.
Dave Wasserman of Cook Political Report (@redistrict) is an essential follow if you want live play-by-play of crucial counties, as are the two Nates — @NateSilver538 and @Nate_Cohn.”
And the good folks at Electoral-Vote.com had some sage advice on where election night results could indicate a developing Blue or Red Wave (as opposed to a 50-50 muddle where it would take several days for the winner to become apparent):
“Many people have already voted but, due to various state laws, we are unlikely to know the winner of the presidential election on Nov. 5. Maybe not even on Nov. 6 if it really is as close as the polls say it is. Much of the problem is due to Republican-controlled state legislatures that want the election to devolve into chaos to provide cover for Donald Trump if he tries to claim victory on Nov. 5 and is then ultimately defeated. The biggest issue is whether absentee ballots can be pre-processed or even fully processed before Election Day. If the process of verifying the signatures on the envelopes may not begin before 7 a.m. on Election Day, there is no conceivable way they can all be verified, the envelopes opened, and the ballots taken out, prepped, and scanned by midnight. Here is the lay of the land by (swing) state:
Arizona: Although Arizona is in the Mountain Time Zone, its results may be available long before some of the swing states in the Eastern Time Zone because Arizona law allows processing of all ballots as soon as they are received and they can be counted as soon as they have been processed. The results may not be released until the polls close, though. If a large number of ballots are dropped off in person on Election Day, that could slow the process down.
Georgia: Not as good as Arizona, but still pretty good. Signatures are verified as the absentee ballots come in, but opening the envelopes may not begin until the third Monday before Election Day. That is to say, Oct. 21. This means that all the absentee ballots arriving before Election Day will be counted before Election Day. Polls close early (7 p.m.) on Election Day. The combination of precounting the absentee ballots and an early closing time in the Eastern Time Zone means that Georgia will probably be the first swing state to report a winner. If it is a blowout either way, that could set the tone for the rest of the night.
Michigan: In Michigan, in all but the smallest jurisdictions, ballots can be preprocessed and counted starting 8 days before the election. Since polls close at 8 p.m., an hour later than Georgia, most likely Georgia will report first, but Michigan will probably be the second swing state to report. If the same candidate wins both of them, that candidate will probably be in for a good night. However, a Harris (Michigan)/Trump (Georgia) split is probably more likely.
Nevada: Signature verification can begin as soon as ballots are received and counting can begin 15 days before the election, so absentee ballots will largely be counted before Election Day, as in Arizona. But since Nevada, unlike Arizona, is an all-mail-in-election state, its results might be available even before Arizona’s. That said, the Silver State is one time zone west of Arizona, and no state can release results until the polls are closed, so maybe not.
North Carolina: Oh boy. Hurricane Helene battered the western portion of the state, so the U.S. Supreme Court gets to call the winner. Not officially (yet), but there are sure to be endless lawsuits due to the difficulty in voting for people in the 25 affected counties. Other than that, the state isn’t so bad. Absentee ballots may be verified and put into the tabulating machines 5 weeks before Election Day. Polls close later than in Georgia (7:30 p.m.) but the big problem here is going to be the western part of the state. Still, fairly early on, there will be a big clue how things are going because the biggest cities (Charlotte, Raleigh, Greensboro, Durham, and Winston-Salem) were not hit by the hurricane and it will be possible to compare their vote totals with 2020. Harris must surge here to win the state and the presence or absence of a surge will be known before the western counties report.
Pennsylvania: Pennsylvania introduced early in-person voting only in 2020, so there is not much experience with it. Unfortunately, early in-person ballots are considered absentee ballots, and these may not be counted until 7 a.m. on Election Day. At least there is no need to verify signatures and open envelopes for the early votes. Still, in a large state that may determine the winner, and where every vote may count, it could take a couple of days to count all the ballots, unless there is an unexpected blowout.
Wisconsin: As we note above, Wisconsin was the third closest state in 2020 (after Georgia and Arizona). Like Pennsylvania, preprocessing of the ballots may not begin in Wisconsin until the polls open on Election Day. If everything ends up depending on Wisconsin, we likely won’t know for a while who won the Badger State. Wisconsin election officials have begged the state legislature to change the law so they can at least pre-process the ballots and have them stacked up, ready to put in the counting machines at 7 a.m. on Election Day, but Republicans in the legislature have no interest in doing so.
The bottom line here is that Georgia will probably come in first, then Michigan, then the eastern part of North Carolina. If there is a huge blue wave, it will show up in the big cities there and that will be a big clue how the state will go. If there is no blue wave, that will also be obvious fairly early.”
Remember my update from a week ago when there was a little under two weeks left? Guess what? It’s now less than one week! 6 days to go as I’m writing this, probably 5 by the time you’re reading it. What’s changed over the last week?
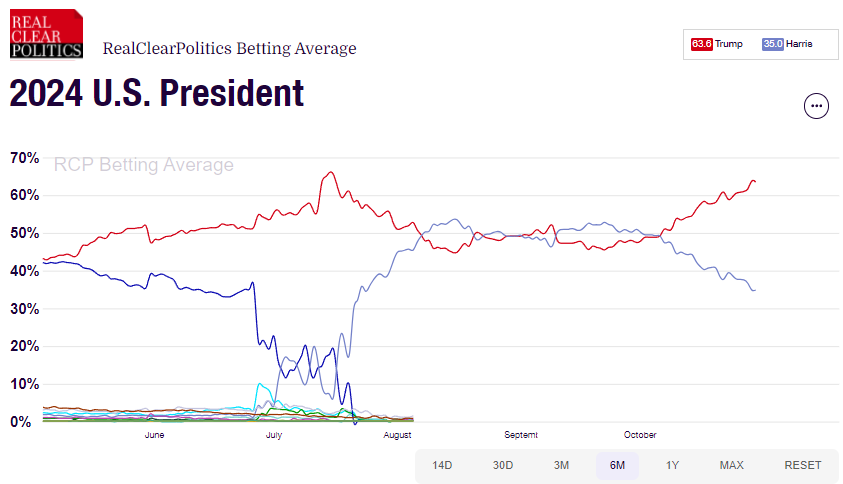
Trump now has a narrow lead in the Real Clear Politics tracking poll. In the more reliable 538 national polling average Harris retains a lead, but it’s down a bit from a week ago. In another perhaps not great sign for the Harris campaign, she’s actually down from her top numbers earlier in the year in both averages:
As noted a week ago there’s a point- somewhere in the neighborhood of 2% to 3%- where a Democratic national lead doesn’t necessarily translate into an Electoral College lead anymore, and Harris remains below that point. So let’s look at the Electoral Vote! On the swing state front, RCP now shows Trump leading in 5 of 7 states, a slip from his 7 of 7 lead a week ago states. 538 has a more robust methodology of weighting polls according to history of pollster accuracy and partisan lean, and it shows a scattered picture- Harris’s lead has expanded a bit in two states, Trump’s lead has expanded a bit in four, and in Nevada Harris is down a little, making that state a tie.
So, less blanket movement toward Trump than a week ago, at which time he had improved vs. Harris in every state except one. But Harris is also down a state from a week ago, and not making progress in four others where she was already behind. Another major takeaway from the chart is that none of the leads for either candidate is outside the margin of error, and in 4 of 7 states they’re separated by less than 1%:
So what does that add up to? RCP still has Trump winning the Electoral College, but not by the blowout form a week ago:
Their map has pretty much now converged with 538’s, except that 538 has Nevada tied:
What was true a week ago remains true- with four states separated by less than 1%, and all seven below the margin of error, it wouldn’t be a major surprise to see either candidate win any particular state. It would even be consistent with these numbers to see either Harris or Trump win all seven (although Trump’s lead in Arizona and Georgia is starting to look more substantial).
Approval ratings, which are another kind of stand in for preference, still show an edge for Harris, but a week ago she had swung back into net negative territory and her negatives have now grown over a week ago. Trump, meanwhile, continues to trend a little less negative, to the point that they’re only separated by 7 points:
Democrats still retain a narrow lead in the Generic Congressional ballot, but down by over a point from a week ago:
A significant indication of overall strength for Democrats remains that, through 100 special elections over the past two years, the party has outperformed by an average of 6% against the partisan lean of the races in question (per a spreadsheet compiled by Nathaniel Rakich of 538):
There’s no change in this indicator, but it remains true that Biden’s percentage in Democratic primaries was ahead of Trump’s in Republican primaries, indicating that Republicans had comparatively more wavering partisan supporters to bring home for their nominee:
The betting markets had shifted toward Trump in a big way a week ago, and have gone even further in that direction over the last week, predicting a more than 63% chance of him winning the election:
Given the closeness of many of the numbers above, and what we’ll be discussing next, there may be an arbitrage opportunity there if anyone is interested… To whit, 538’s forecast model is basically 50/50:
538’s now solo founder Nate Silver has his model behind a paywall, but did give an update on it today that is a little more positive for Trump, but is still very close to 50/50:
If we do a map that leaves blank the four states that are within 1%, there is one path by which Harris could get there, winning all three of Michigan, Pennsylvania, and Wisconsin. Trump would win with any one of the three:
Overall, it feels to me like some slowing (but not stopping) of the motion toward Trump, mixed with an improved sign or two for Harris. There are some reasons to think that things could be better for Harris than the polls indicate:
As mentioned earlier, in 100 special elections over the past two years, Democrats have consistently done better by several percentage points than the dynamics of the races would indicate
Harris is running behind Democratic Senate candidates in several swing states and, other things being equal, it would be surprising if her numbers didn’t end up equalizing a little more there
Pollsters may have bent over backwards to correct the sampling models that had them systemically underestimating Trump supporters in 2016 and 2020, and may now be systemically overestimating his support
These are all logical takes, supported by some empirical data, but the logic here cuts both ways. If polls are underestimating Harris by a few percent, she could be headed for a blowout. On the other hand, if they’re still underestimating Trump the way they did the last two cycles, he could be headed for a blowout. Or, things could be exactly as they appear, and a handful of votes in a few key states could see either candidate squeak by.
My best advice is to follow some of the most empirically grounded commentators on the lead-up to election night (and on election night itself). Axios had a good round-up of suggested follows recently:
“Pick a few trustworthy accounts rather than gorging on whatever pops up.
Jon Ralston (@RalstonReports) is your man in Nevada … Garrett Archer (@Garrett_Archer) in Arizona … Greg Bluestein (@bluestein) and the Atlanta Journal-Constitution crew in Georgia.
Dave Wasserman of Cook Political Report (@redistrict) is an essential follow if you want live play-by-play of crucial counties, as are the two Nates — @NateSilver538 and @Nate_Cohn.”
And the good folks at Electoral-Vote.com had some sage advice on where election night results could indicate a developing Blue or Red Wave (as opposed to ye olde 50-50 muddle which would take days to untangle):
“Many people have already voted but, due to various state laws, we are unlikely to know the winner of the presidential election on Nov. 5. Maybe not even on Nov. 6 if it really is as close as the polls say it is. Much of the problem is due to Republican-controlled state legislatures that want the election to devolve into chaos to provide cover for Donald Trump if he tries to claim victory on Nov. 5 and is then ultimately defeated. The biggest issue is whether absentee ballots can be pre-processed or even fully processed before Election Day. If the process of verifying the signatures on the envelopes may not begin before 7 a.m. on Election Day, there is no conceivable way they can all be verified, the envelopes opened, and the ballots taken out, prepped, and scanned by midnight. Here is the lay of the land by (swing) state:
Arizona: Although Arizona is in the Mountain Time Zone, its results may be available long before some of the swing states in the Eastern Time Zone because Arizona law allows processing of all ballots as soon as they are received and they can be counted as soon as they have been processed. The results may not be released until the polls close, though. If a large number of ballots are dropped off in person on Election Day, that could slow the process down.
Georgia: Not as good as Arizona, but still pretty good. Signatures are verified as the absentee ballots come in, but opening the envelopes may not begin until the third Monday before Election Day. That is to say, Oct. 21. This means that all the absentee ballots arriving before Election Day will be counted before Election Day. Polls close early (7 p.m.) on Election Day. The combination of precounting the absentee ballots and an early closing time in the Eastern Time Zone means that Georgia will probably be the first swing state to report a winner. If it is a blowout either way, that could set the tone for the rest of the night.
Michigan: In Michigan, in all but the smallest jurisdictions, ballots can be preprocessed and counted starting 8 days before the election. Since polls close at 8 p.m., an hour later than Georgia, most likely Georgia will report first, but Michigan will probably be the second swing state to report. If the same candidate wins both of them, that candidate will probably be in for a good night. However, a Harris (Michigan)/Trump (Georgia) split is probably more likely.
Nevada: Signature verification can begin as soon as ballots are received and counting can begin 15 days before the election, so absentee ballots will largely be counted before Election Day, as in Arizona. But since Nevada, unlike Arizona, is an all-mail-in-election state, its results might be available even before Arizona’s. That said, the Silver State is one time zone west of Arizona, and no state can release results until the polls are closed, so maybe not.
North Carolina: Oh boy. Hurricane Helene battered the western portion of the state, so the U.S. Supreme Court gets to call the winner. Not officially (yet), but there are sure to be endless lawsuits due to the difficulty in voting for people in the 25 affected counties. Other than that, the state isn’t so bad. Absentee ballots may be verified and put into the tabulating machines 5 weeks before Election Day. Polls close later than in Georgia (7:30 p.m.) but the big problem here is going to be the western part of the state. Still, fairly early on, there will be a big clue how things are going because the biggest cities (Charlotte, Raleigh, Greensboro, Durham, and Winston-Salem) were not hit by the hurricane and it will be possible to compare their vote totals with 2020. Harris must surge here to win the state and the presence or absence of a surge will be known before the western counties report.
Pennsylvania: Pennsylvania introduced early in-person voting only in 2020, so there is not much experience with it. Unfortunately, early in-person ballots are considered absentee ballots, and these may not be counted until 7 a.m. on Election Day. At least there is no need to verify signatures and open envelopes for the early votes. Still, in a large state that may determine the winner, and where every vote may count, it could take a couple of days to count all the ballots, unless there is an unexpected blowout.
Wisconsin: As we note above, Wisconsin was the third closest state in 2020 (after Georgia and Arizona). Like Pennsylvania, preprocessing of the ballots may not begin in Wisconsin until the polls open on Election Day. If everything ends up depending on Wisconsin, we likely won’t know for a while who won the Badger State. Wisconsin election officials have begged the state legislature to change the law so they can at least pre-process the ballots and have them stacked up, ready to put in the counting machines at 7 a.m. on Election Day, but Republicans in the legislature have no interest in doing so.
The bottom line here is that Georgia will probably come in first, then Michigan, then the eastern part of North Carolina. If there is a huge blue wave, it will show up in the big cities there and that will be a big clue how the state will go. If there is no blue wave, that will also be obvious fairly early.”
We’ll check in one final time Sunday evening with 36ish hours to go. Until then, our indicators are:
Last year was the 50th anniversary of hip hop, and in honor of this anniversary, the idea bloomed in my mind that I should review the top 50 albums of that 50 years. As I crunched together a list from various sources, 50 proved to be too restrictive- many of the classics were getting squeezed out. So, to make a little more room, I opted for 100 albums, two for each of hip hop’s 50 years.
For its formative years, hip hop was a live entertainment form, with the first recorded singles not emerging until 1979, and the first albums in 1980. So my review will cover 1980-2023, with 50 posts of two albums each. The only ground rule I made for myself (besides looking for 2×50, aka 100, albums that were widely well-regarded) was that I had to have at least one from each year. As you’ll see by and by, some years get multiple albums, but since we have 100 spots for 43 years, it tends to all work out.
*June 2024 addendum: Due to some medical situations, I took a three+ month hiatus from blogging. It’s unlikely I’ll finish this series this year. But I’m back at it, and I won’t mind extending into 2025 if you don’t!*
And with that, let’s embark on our next installment!
The D.O.C, No One Can Do It Better(1989)– This sounds to me like an encapsulation of 80s hip hop- it’s replete with the breaks, turntabilism, and hard rock samples of the new school, and the soul and funk samples and swing of new jack. It also exemplifies the hard-hitting gangsta rap sound of the eighties as it was turning to the G-funk gangster sound of the nineties, but with a substantive heft more reminiscent of Public Enemy. My initial impression on this is backed up by subsequent research- Tracy Lynn Curry, a.k.a. The DOC, came out of Houston’s Southern hip-hop scene, but became a collaborator with N.W.A. and even contributed lyrics to their debut album. They returned the favor here, Dr. Dre producing this album, multiple N.W.A. members contributing to various tracks, and Eazy-E putting it out on his fledgling record label. For good measure, one of the closing tracks of the album, “The Formula” is even credited as being the first G-funk single. Shortly after release, The D.O.C. would join Dre in becoming one of the co-founders of Death Row Records. All in all, a solid album that feels like the eighties turning into the nineties.
Ice Cube, AmeriKKKa’s Most Wanted (1990)- I think it’s no accident that this installment of the blog is feeling all kinds of liminal. With this album, we have a double milestone- it’s our 34th review, meaning we’ve now made it past one third through, and it’s the first album on the list from the nineties. After Ice Cube split from N.W.A. and their record label amidst various financial disputes, he worked with lyrics from Dr. Dre’s cousin Sir Jinx and production from Public Enemy’s Bomb Squad to make this solo debut. The album feels like it puts together the best of all these worlds- Ice Cube’s hard-hitting delivery, the humor of Southern California gangsta rap, the densely layered production of Public Enemy, and both N.W.A.’s and Public Enemy’s versions of social and political commentary. It also brings along Ice Cube’s considerable misogyny and revelry in scenes of violence. But it sounds consistently powerful and high quality, and dives full-force into its mission of rubbing America’s face in everything about rap in general and Ice Cube in particular that made it uncomfortable. That’s not a bad way for the genre to kick off the nineties!
If you’re curious about the sources I used to compile my list, you can check them out here:
Finally, if you’d like a playlist for the entire list, you can find that here. Listen to it sequentially for the historical development of the genre, or play on shuffle for maximum historical scramble!
Holy avocado dip, it is now thirteen days until Election Day! Two weeks ago, our one monthish outlook showed advantage still Harris, but signs of a significantly tightening race. Where are we now with less than two weeks to go and early voting underway in 39 states?
Harris maintains a lead in both the Real Clear Politics and 538 national polling averages, though down in both compared to a week ago. In both cases her lead is within the margin of error, but the more solidly founded 538 average shows an unmistakable lead is being maintained:
That narrowing margin is significant though, because there’s a point- somewhere in the neighborhood of 2% to 3%- where a Democratic national lead doesn’t necessarily translate into an Electoral College lead anymore because of state by state dynamics and the misproportioned nature of how that system works. On the swing state front, RCP now shows Trump leading all 7 states. 538 has a more robust methodology of weighting polls according to history of pollster accuracy and partisan lean, and it shows a slightly better picture for Harris, but a similar dynamic.
Trump has improved vs. Harris in every state except North Carolina compared to two weeks ago, including pulling into a narrow lead in Pennsylvania, such that he is now ahead in 4 of 7. Another major takeaway from the chart is that none of the leads for either candidate is outside the margin of error, and in 5 of 7 states they’re separated by less than 1%:
So what does that add up to? RCP has Trump sweeping the Electoral College:
Using the 538 state polls it’s closer, but Trump still tops 270 with room to spare:
As was noted two weeks ago, though, with all seven swing states within a margin of error, and five of them separated by less than 1%, it would be perfectly plausible to see either Harris or Trump win all seven. The main thing that’s true is that it’s very, very close.
Approval ratings, which are another kind of stand in for preference, still show an edge for Harris, but she’s swung back into net negative territory, and Trump has trended up a bit compared to last time:
Democrats still retain their lead in the Generic Congressional ballot, and are up just a smidge from two weeks ago:
A significant indication of overall strength for Democrats remains that, through 100 special elections over the past two years, the party has outperformed by an average of 6% against the partisan lean of the races in question (per a spreadsheet compiled by Nathaniel Rakich of 538):
There’s no change in this indicator, but it remains true that Biden’s percentage in Democratic primaries was ahead of Trump’s in Republican primaries, indicating that Republicans had comparatively more wavering partisan supporters to bring home for their nominee:
The betting markets, meanwhile, are now going for Trump in a big way, predicting a more than 60% chance of him winning the election:
Taking all this together, the two main things that stand out compared to two weeks ago are that there’s been movement toward Trump, and everything is converging on being very, very close. And indeed, that’s where our forecast models are coming out. Witness 538:
538’s now solo founder Nate Silver has his model behind a paywall, but does give periodic updates on what it’s saying:
So, as was true two weeks ago, two of the best forecast models out there have the election basically down to a coin toss. Circling back for a second to 538’s state averages:
If we do a map that leaves blank the five states that are within 1%, there are four different ways Harris could get there, and seven ways Trump could, any of which might happen by not more than a few thousand votes:
We’ll check in again next week at a week to go to see if things are any clearer. Until then, our indicators are:
Tuesday this week was exactly 28 days (aka four weeks) until Election Day! When we did our two month outlook, things seemed to have turned sharply toward Harris. Since that post we’ve had the first (and apparently, only) debate between the two candidates, the Vice Presidential debate, a second assassination attempt, and bullish economic signs galore while the conflict in the Middle East meanwhile expands. And, significantly, the election is underway- 18 states are already doing early voting and/or have mailed out ballots. In the midst of all this, what are the numbers showing?
Harris maintains a lead in both the Real Clear Politics and 538 national polling averages, widening it a little in RCP, and narrowing it a little in 538, with total undecided down in each. In both cases her lead is within the margin of error, but the impression of Harris maintaining a lead is clear:
Ah, but the election isn’t decided nationally, is it? At this moment only seven states are seriously in doubt, and what happens in these states is what it will all come down to. RCP now shows Harris leading in 2 of 7, and 538 with its more robust methodology has her ahead in 4 of 7. This chart overwhelmingly gives an impression of tightening. One state flipped form Harris to Trump since last time, one flipped from Trump to Harris, and 6 of 7 have a margin of less than 1%:
So what does that add up to? RCP currently has Trump winning the electoral vote in its “no toss-ups” map:
As mentioned above, 538 uses a more robust methodology for its averages (they weight things according to pollster track record and history of partisan lean) and their current polling averages would give Harris a narrow win:
The important thing to keep in mind here is that, with all seven swing states within a margin of error, and six of them separated by less than 1%, the most substantive thing we can say is that it’s very close. While a mixed result is most likely, based on these polls it wouldn’t be ridiculous to see Harris or Trump win all seven.
So what else can we look at? The approval ratings comparison is another stand in for preference, and it shows a clear edge for Harris. She has swung into positive territory, while Trump remains more than nine points net negative:
Democrats also retain their lead in the Generic Congressional ballot, though by less than a month ago:
And, through 100 special elections over the past two years, Democrats have outperformed by an average of 6% against the partisan lean of the races in question (per a spreadsheet compiled by Nathaniel Rakich of 538):
There’s no change in this indicator, but it remains true that Biden’s percentage in Democratic primaries was ahead of Trump’s in Republican primaries, indicating that Trump had comparatively more wavering partisan supporters to bring home:
The betting markets, meanwhile, have doubled down on the edge they gave Trump last month (see what I did there?), predicting a 53% chance of him winning the election:
Taking everything together, Harris retains an overall edge in the leading indicators, but tightening of the race since a month ago is readily apparent. That’s where 538’s forecast model comes out, giving Harris an edge, but not a huge one:
538’s founder Nate Silver left 538 in May 2023 as Disney/ABC was making huge layoffs there and struck out on his own. He took the proprietary code for 538’s original model with him, and has built a new model based on it. It’s behind a paywall, but he issues periodic updates and his latest comes out nearly exactly where his former colleagues are:
So, the best models out there have the election pretty close to being a coin toss. And let us now pause to remember that the 2016 election came down to 78,000 votes in Michigan, Pennsylvania, and Wisconsin, and the 2020 election came down to 42,000 votes in Georgia, Arizona, and Wisconsin. Clinton lost 2016 despite winning the vote by +2.2%, and Biden barely won 2020 while winning the vote by +4.5%. This is probably going to be a long election night/week…
We’ll check in again week after next with two weeks to go! Until then, our indicators are:
This past Thursday marked just two months until Election Day! When we last checked in about a month ago, the dramatic switch from Biden to Harris had seemingly shaken up the race, and strengthened the Democratic Party’s position. Since then, we’ve had Harris officially become the nominee, her popular and meme-inspiring choice of Tim Walz as her running mate, and the Democratic convention. We’ve even had enough time for the effect of the convention to fade and normalize a bit, and Robert Kennedy Jr. abandoning his third party bid and endorsing Trump for good measure. So, given all of this, how are things looking?
To start with, Harris has maintained her lead in both the Real Clear Politics and 538 national polling averages, and in fact widened it in both versus a month ago. The more robust of the two, 538 (which weights things according to pollster track record and history of partisan lean, and adjusts for state polling), has a Harris margin just a smidge outside the typical margin of error of around 3%, so it’s close, but the momentum for Harris is clear in each average:
Polls of the swing states are showing a similar momentum toward Harris*. RCP now shows Harris leading in 4 of 7 with another one even, and 538 with its more robust methodology has her ahead in 5 of 7. It’s important to note that all of these leads in either direction are within the margin of error. And, per the * above, Harris now has leads in more states than a month ago, but also has seen some tightening in two of her leads versus a month ago. All in all this is a picture of a very close race, but the overall movement is toward Harris:
As you might expect from the state trends, the electoral vote outlook for Harris has improved over a month ago, and even the more Republican-tilted RCP map shows the Democrats ahead for the first time since we started tracking in May. Again it’s a narrow margin, a flip of any single swing state here could put Harris behind (or, if it’s a Trump state, give her a stronger lead):
The approval ratings comparison is now much clearer than a month ago as well. Harris has basically pulled even in net approval, whereas Trump’s negative numbers have widened somewhat, and are now approaching 10%. Once again, advantage Harris:
Democrats are also recording their largest lead this year in the Generic Congressional ballot:
And, while there haven’t been new data points on this since a month ago, in nearly 100 recent special elections through the end of July, Democrats have outperformed by an average of 6% against the partisan lean of the races in question (per a spreadsheet compiled by Nathaniel Rakich of 538):
Again, no change in this, but it remains true that Biden’s percentage in Democratic primaries was ahead of Trump’s in Republican primaries, indicating that Trump had more wavering partisan supporters to bring home than Biden:
In the one contra-indicator since last time, Trump has now re-taken a small lead against Harris in Presidential betting markets:
Putting all this together, Harris is even more clearly outperforming Trump at this point than she was a month ago. Not only is almost all the motion over the past month toward her, but with Kennedy out and the conventions concluded, the undecideds are now down to about 8.5%, meaning there are fewer folks out there to sort out.
At the same time, it’s difficult to miss that the numbers indicate a close race. It is now time for our standard disclaimer that the 2016 election came down to 78,000 votes in Michigan, Pennsylvania, and Wisconsin, and the 2020 election came down to 42,000 votes in Georgia, Arizona, and Wisconsin. Even if we take on face value 538’s 3% national lead for Harris, that’s right in the middle of Clinton’s 2016 +2.2% and Biden’s 2020 +4.5%, and both of those were squeakers on the electoral college front.
Still and all, there’s no mistaking the movement toward Harris over a month ago:
We’ll check in again in October, at which point we’ll have another debate or two behind us, and one month to go!
I’m about a week late on putting this out due to various work/life reasons, but this past Monday was three months to Election Day. And what a difference the five weeks since our last update has made! The Rematch of the Century is no more. But, with Joe Biden withdrawing his name from consideration, endorsing Vice President Kamala Harris, and the Democratic establishment and the grassroots swiftly and enthusiastically consolidating around her, a new tagline has been born: Prosecutor vs. Felon!
A big, in fact, unprecedented shakeup, but has it had an effect on the dynamics of the race? As we’ll see shortly, it definitely has!
Looking at the Real Clear Politics and 538 national polling averages, what immediately jumps out is that, for the first time since we started looking at this three months ago, Trump is no longer in the lead. RCP’s average now has a small lead for Harris. 538 (which weights things according to pollster track record and history of partisan lean, and adjusts for state polling) has an even clearer margin in Harris’s favor:
Polls of the swing states are showing the same effect. While for months Trump was at 7 for 7, RCP now shows Harris leading in 2 of 7, and 538 with its more robust methodology has her ahead in 3 of 3, with another one even. All of these leads are within the margin of error, but that’s kind of the point- they all are, even the Sunbelt states where Trump had enjoyed leads outside the margin of error in prior months. Here are the current 538 numbers by state:
538’s map would already have Harris with enough electoral votes to win, and even the more Republican-tilted RCP map shows her gaining ground:
Approval ratings are now a little trickier to gauge. We used to be able to compare Biden to previous Presidents at the same point in their first terms, but that no longer works. What we can do is compare Harris’s approval rating to Trump’s, and when we do so we can see that Harris’s net approval rating has surged since Biden’s withdrawal, and is now pretty much a wash with Trump’s (these averages are from 538):
Moving on, Democrats retain their lead in the Generic Congressional ballot:
Even more hopefully for Democrats, through the end of July they continue to outperform in special elections over the past year+, running an average of 6% ahead of the partisan lean of the races in question (per a spreadsheet compiled by Nathaniel Rakich of 538):
Our previous hypothesis about Biden’s percentage in Democratic primaries being ahead of Trump’s in Republican primaries, was that Trump had more wavering partisan supporters to bring home than Biden:
Finally, in line with many of the indicators above, Presidential betting markets now show Harris ahead of Trump:
So what does all this add up to?
Harris is clearly outperforming Trump at this point, having taken the lead in several key indicators and drawn even in others. Crucially, the 538 average shows Kennedy’s numbers cut in half at 5.1%, and undecided down from 8% a month ago to 5.8%. I’d speculated before that the nearly 20% sitting on the sidelines between Kennedy and undecided indicated that there was a significant block of voters who were saying they didn’t like their choices, but would eventually sort out for Biden or Trump. Currently, they appear to be sorting toward the Democrats.
This is not to say Harris will win, but one could certainly look at these numbers and conclude she very well might. One would have been hard pressed to make that case for Biden in the last three months based on data alone. We’ll check in again in September, but for the moment the campaign’s momentum is clearly toward Harris:
As of this past Friday, the General Election was only four months out, so here we are with the latest overview! Let’s start with the elephant in the room: after Biden’s thoroughly lackluster debate performance on June 27th seemingly confirmed carefully manufactured fears about his physical and mental fitness, there has been a chorus of calls for him to drop out for the good of the party and the nation, and it’s not really letting up ten days later.
But wait, did I say carefully manufactured? Indeed. As with something… something… her e-mails… in 2016, there has been an orchestrated social media campaign on the Right (possibly aided again by foreign sources) to incubate this fear, and a too-credulous and irresponsible press has gone along for the ride:
While the creation of the issue has been by artifice, Biden’s performance certainly lends some substance to it. However, I’m not here to discuss that. I’m looking at the data behind electoral trends for the two nominees, and for the moment Biden is still the nominee-elect. If a month from now it’s Harris, or Newsom, or a hybrid clone of Clinton and Obama, I’ll look at the data trends for that, but for now I’m looking at what we’ve got. Okay! So what do we have?
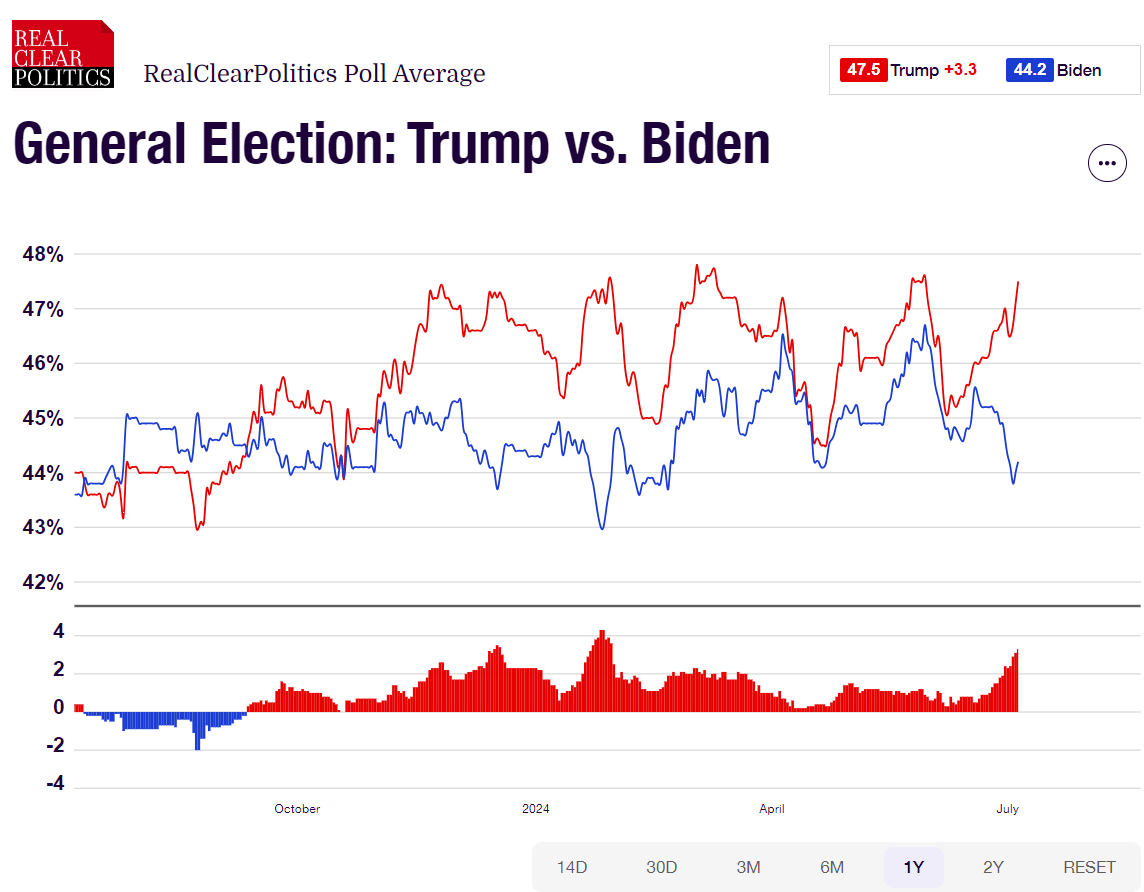
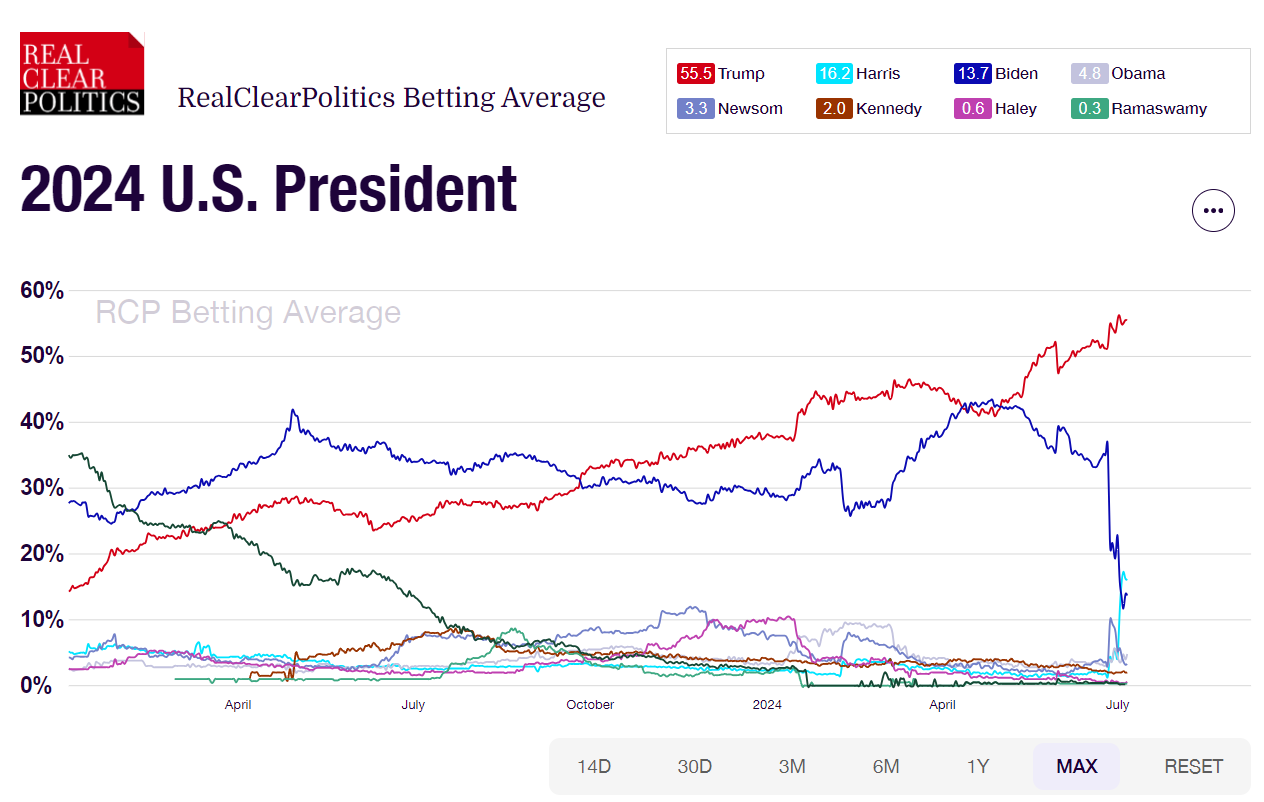
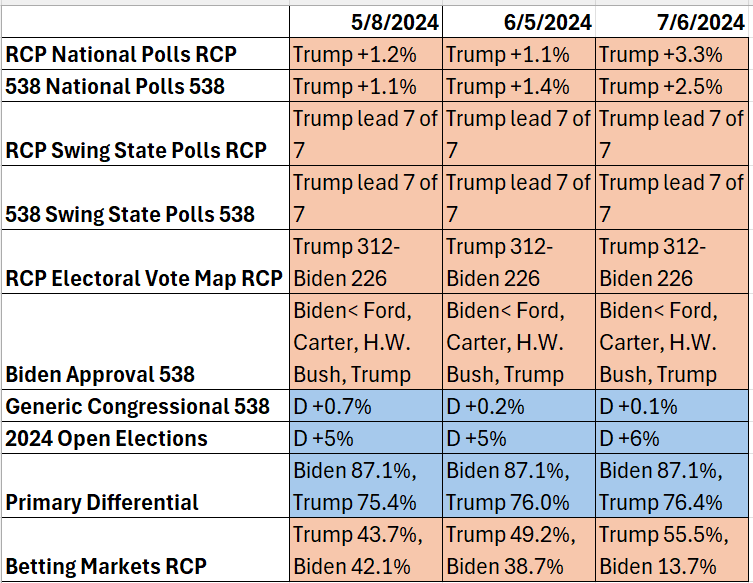
Looking at the national polls, the effect of the debate is certainly showing up in the Real Clear Politics and 538 polling averages. Both averages had been showing pro-Biden momentum following Trump’s felony conviction, but the debate effect has blown that out of the water. RCP’s average now has a Trump lead outside the standard 3% margin of error. 538 (which weights things according to pollster track record and history of partisan lean, and adjusts for state polling) is a little lower, and still within the margin:
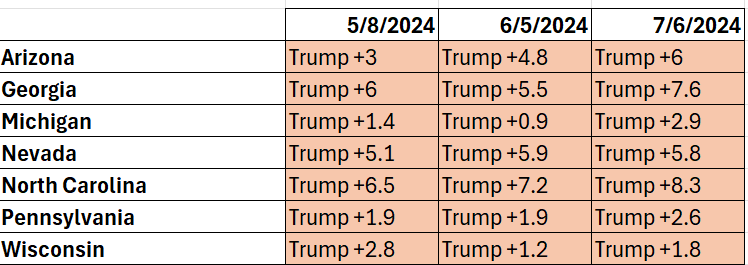
Polls of the swing states are showing the same effect. Both RCP and 538 continue to have Trump leading in 7 of 7, and by wider margins than a month ago in 6 of the 7. The only good news for Biden is that the three Midwestern states are still within the margin of error, and together they could give him just enough electoral votes. Here are the current 538 numbers by state:
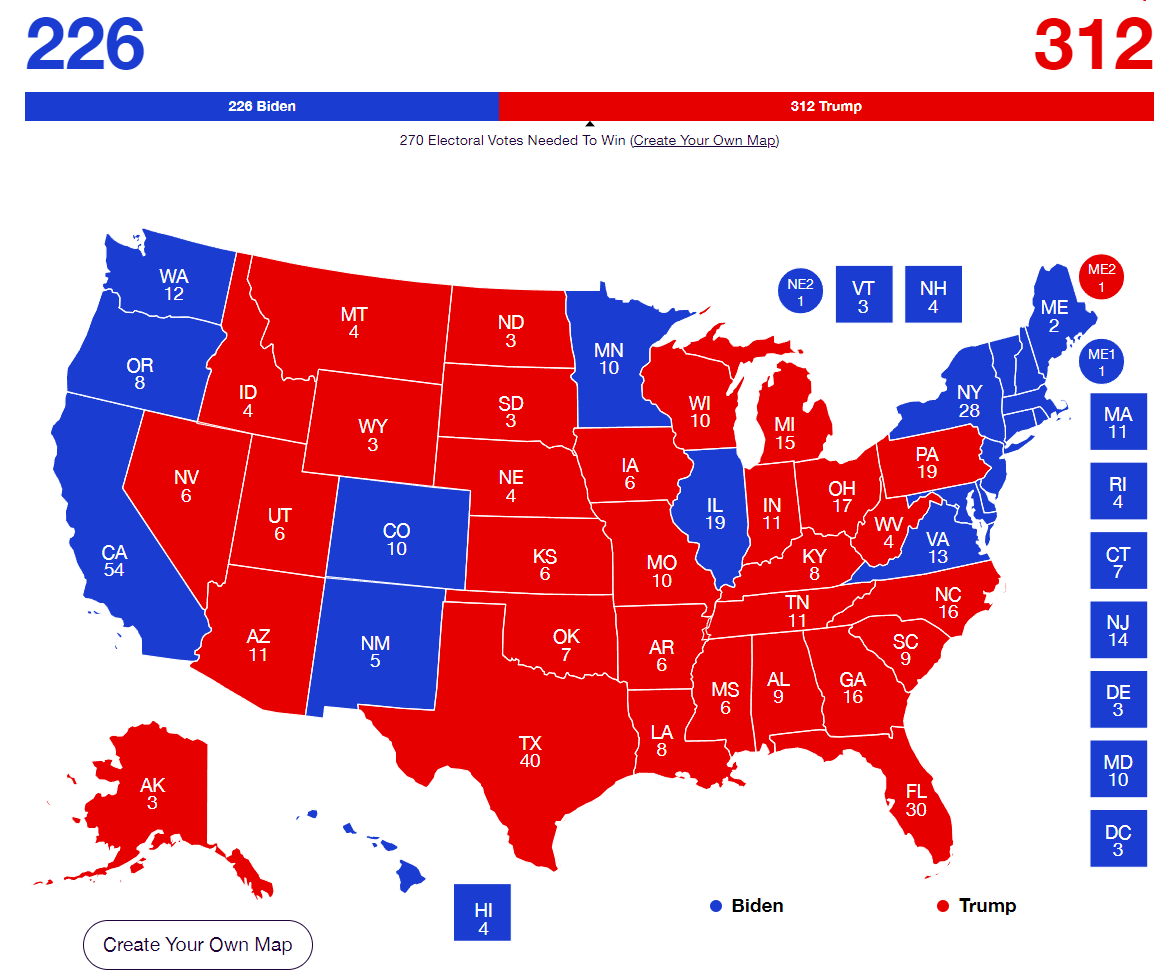
Speaking of the electoral college, on that front, as per the swing state results, the current map continues to have Trump well ahead:
In Presidential Approval ratings, Biden remains underwater, and the post-debate results have increased the gap to over 20 points (this average is from 538):
As one might expect from all of the above, Biden’s net approval numbers most resemble those of the recent Presidents who lost after one term (Ford, Carter, H.W. Bush, and Trump):
Democrats do retain the slightest lead in the Generic Congressional ballot:
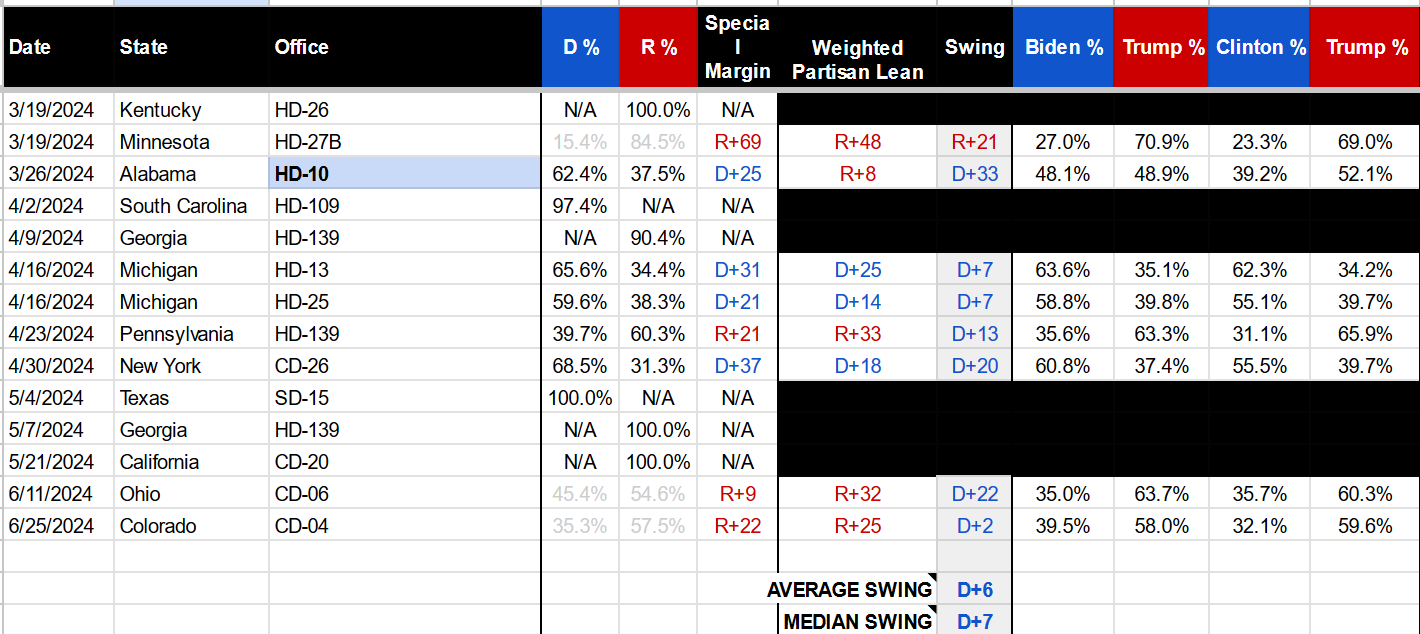
More hopefully for Democrats, through the end of June they continue to outperform in special elections over the past year+, running an average of 6% ahead of the partisan lean of the races in question (per a spreadsheet compiled by Nathaniel Rakich of 538):
It remains true that Biden’s percentage in Democratic primaries is ahead of Trump’s in Republican primaries, which other things being equal would seem to indicate that Trump has more wavering partisan supporters to bring home than Biden:
Finally, we can check in on Presidential betting markets. They have sharply reacted to the debate, and currently have Biden’s numbers totally collapsed, such that he is slightly behind Harris:
So what does all this add up to?
Biden’s numbers have certainly taken a major hit in the past month. On the other hand, the 538 average continues to show Kennedy at an implausible nearly 10%, and 8% undecided, suggesting that about 18% of the electorate is still in play. And Democrats clearly retain a generic average in terms of Congressional preference and outperforming in open elections.
The pro-Biden argument from this is that he has plenty of room to grow support versus the tiny margins that may be needed in key states. On the other hand, this could as easily be an argument that another Democrat could do much better than Biden, as voters consistently indicate reservations about him vs. general support of Democrats. As tiresome as it is to continually look to the future, I think we may have to wait a month to see if the post-debate damage reverts to the mean, if Biden has ridden out calls for him to step down, and if any more of the nearly 20% undecided block has sorted itself out.
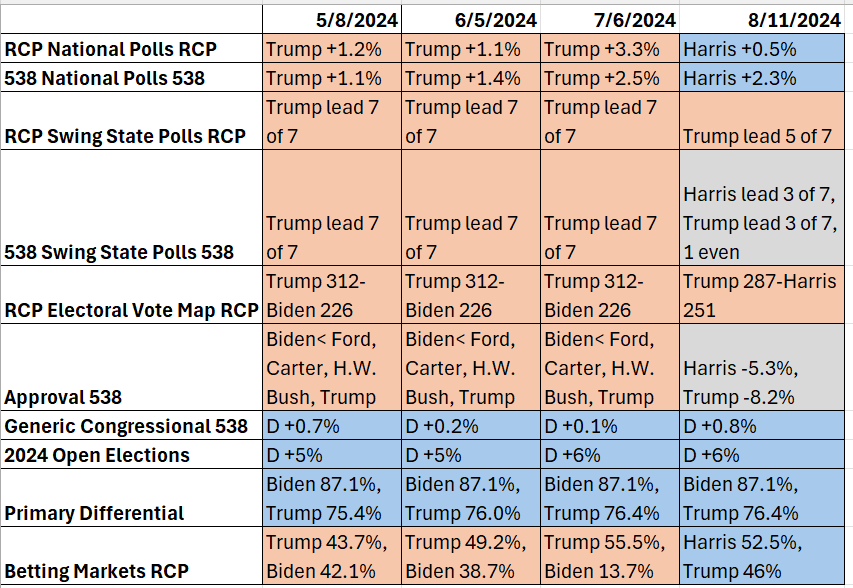
Until then, these are our data points, which have remained generally pretty consistent over the last two months: