
As I’m sitting down to write this Sunday night, there are about 35 hours until polls open. If you’re reading it Monday, it’s less than 24! So here we are, at our last update before the election itself. What does the semi-final picture look like?
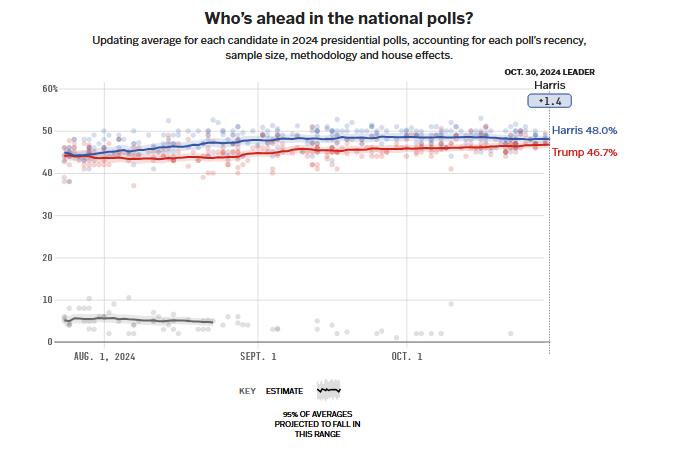
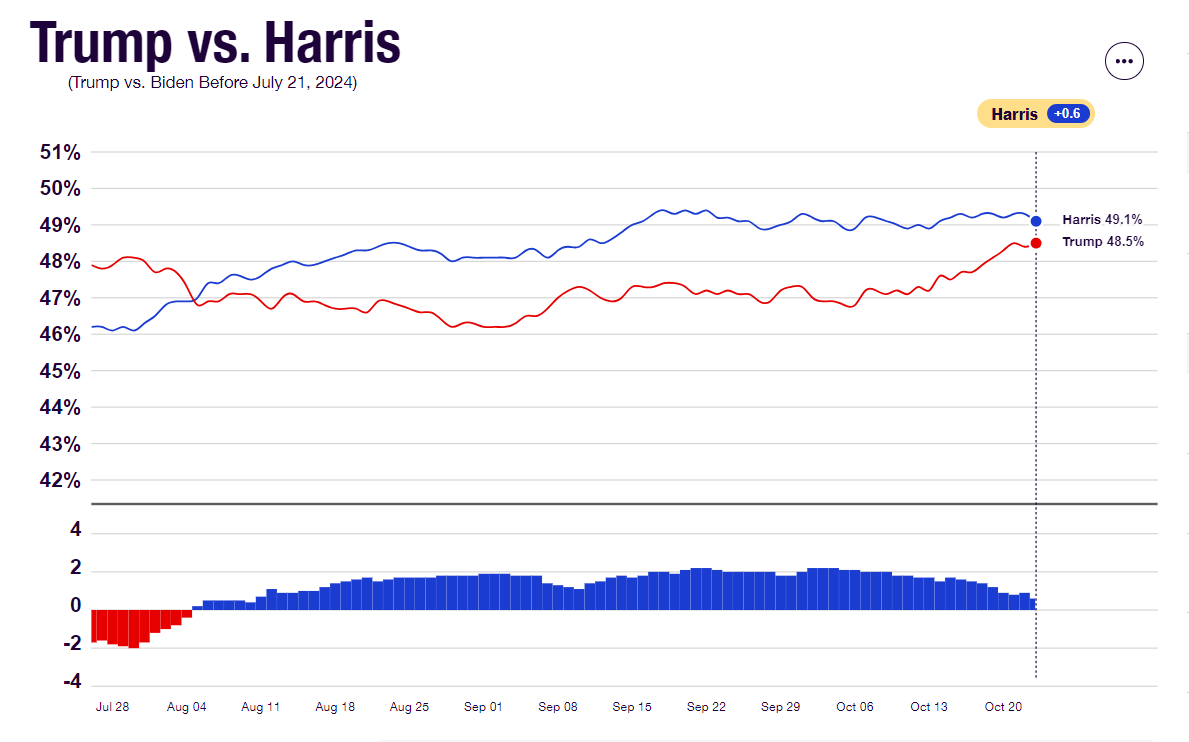
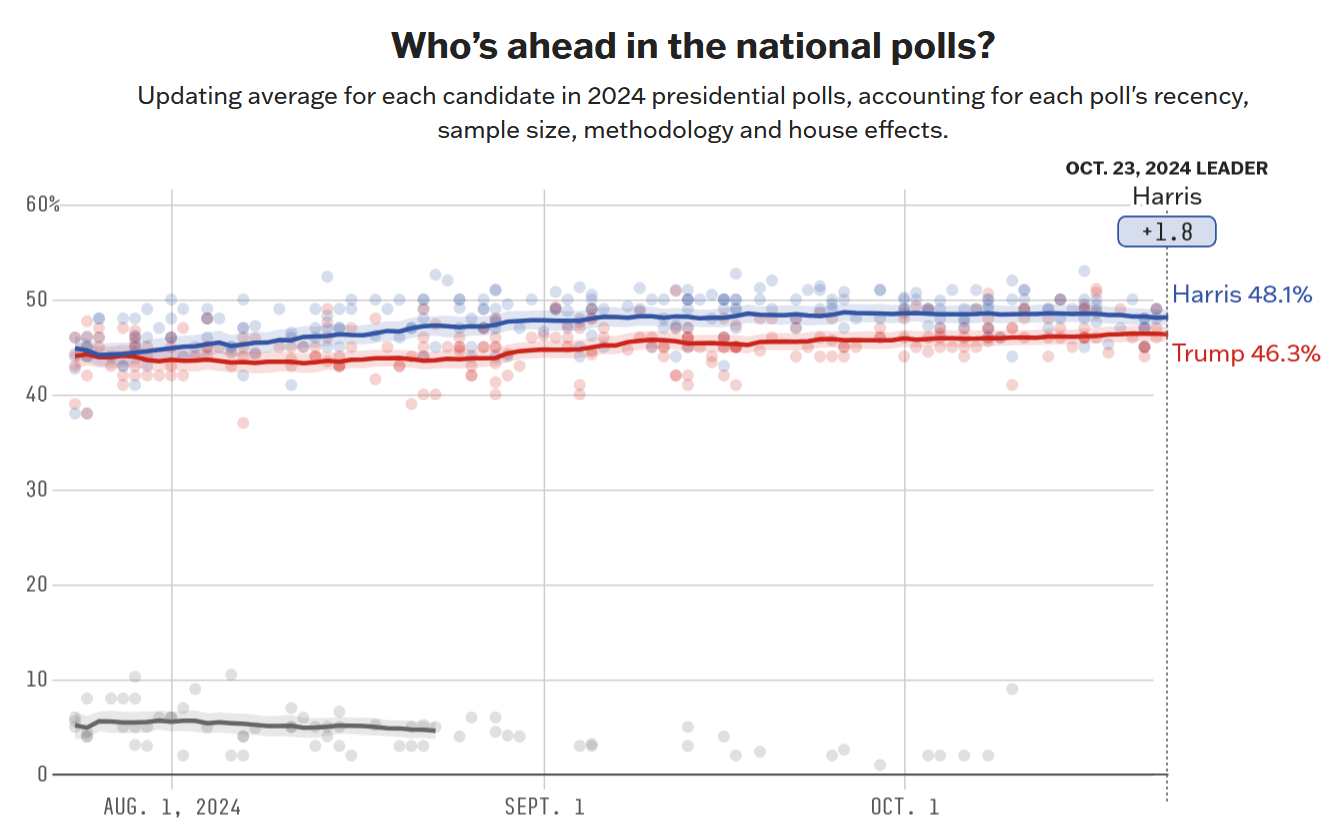
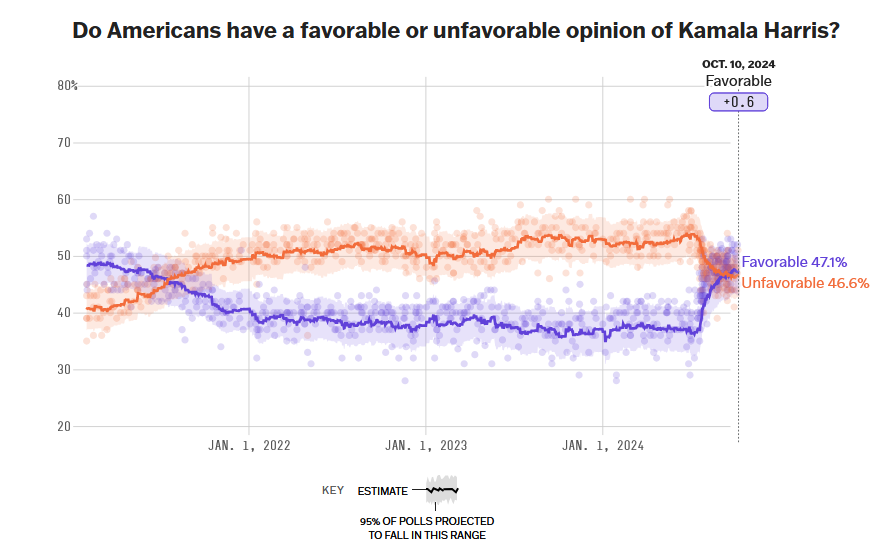
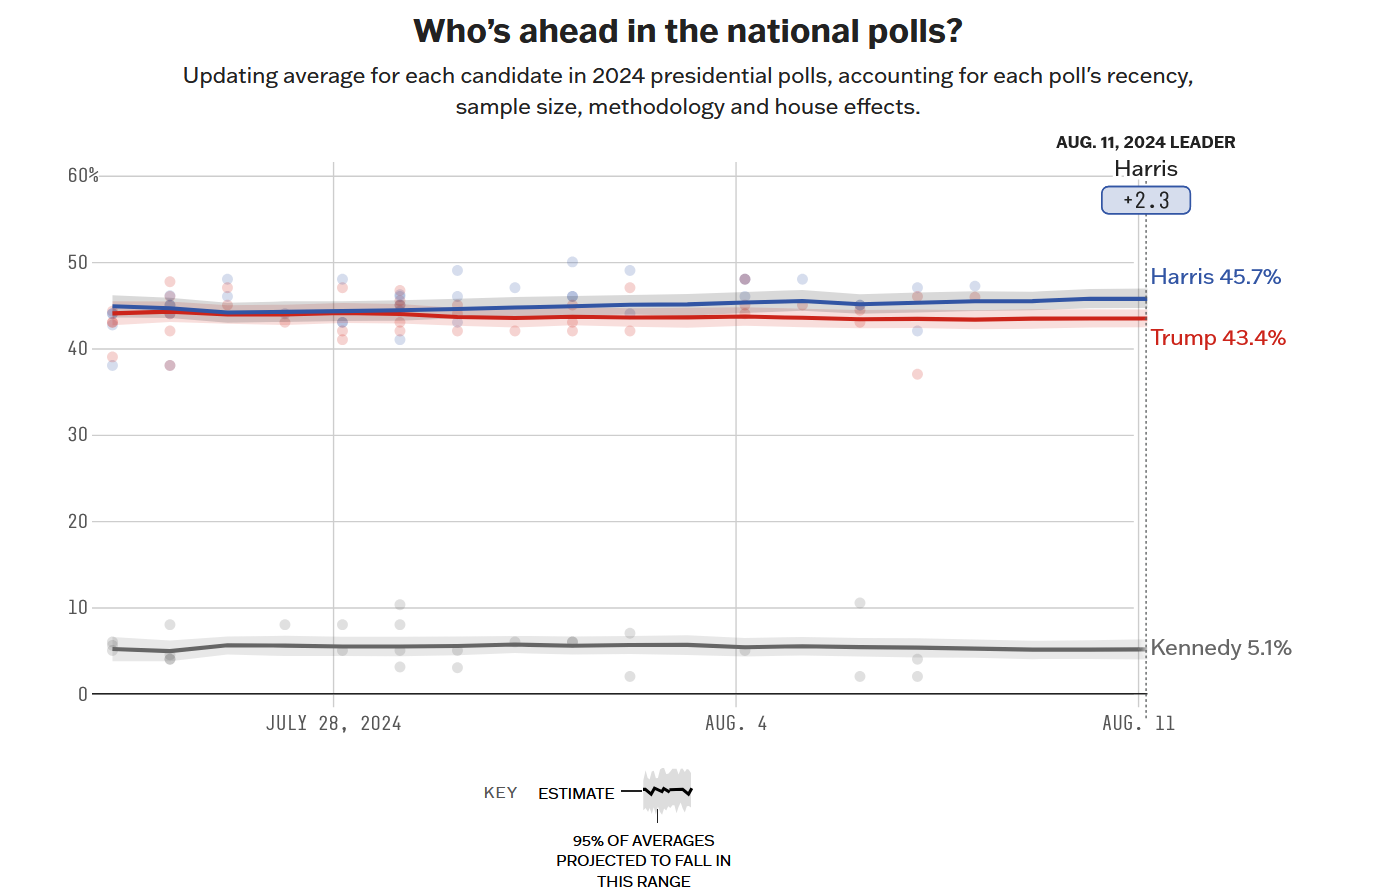
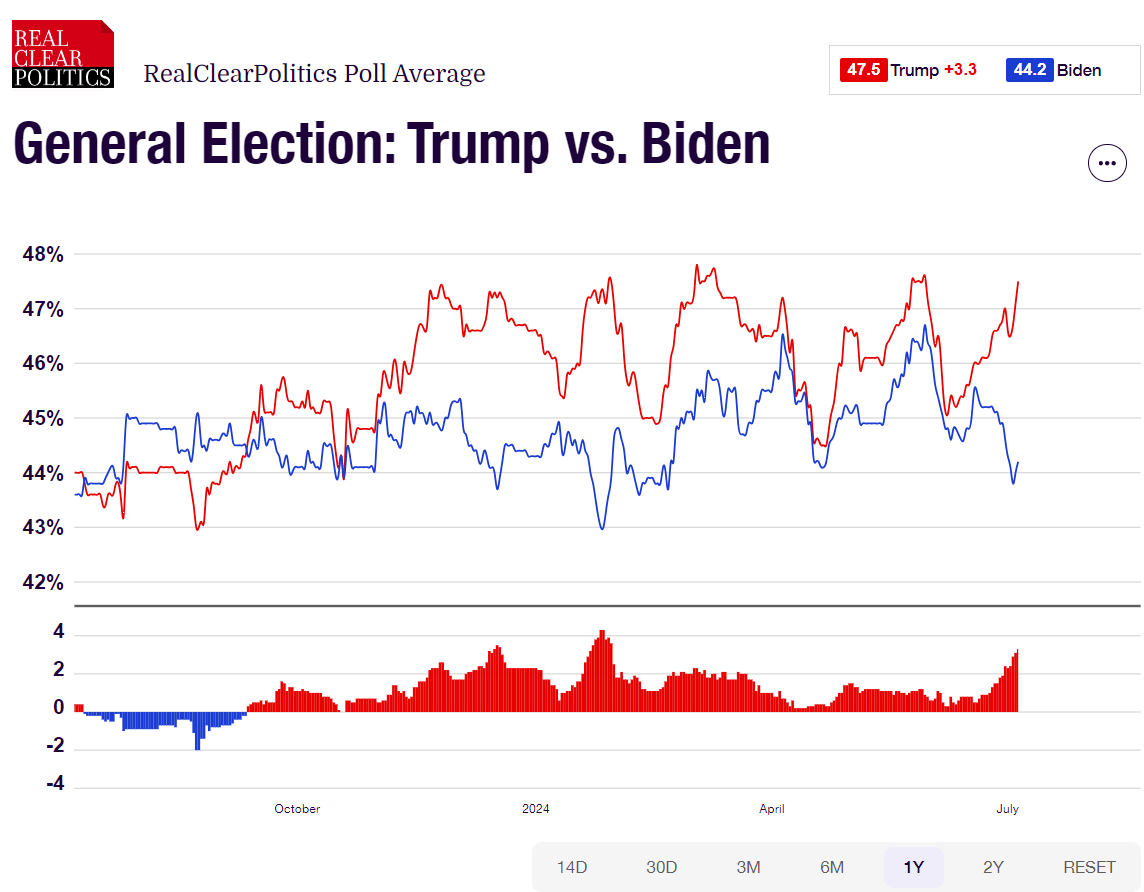
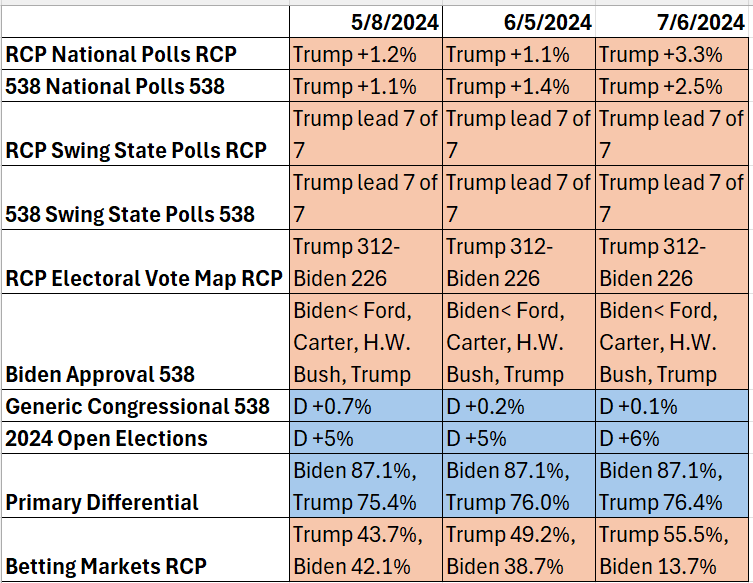
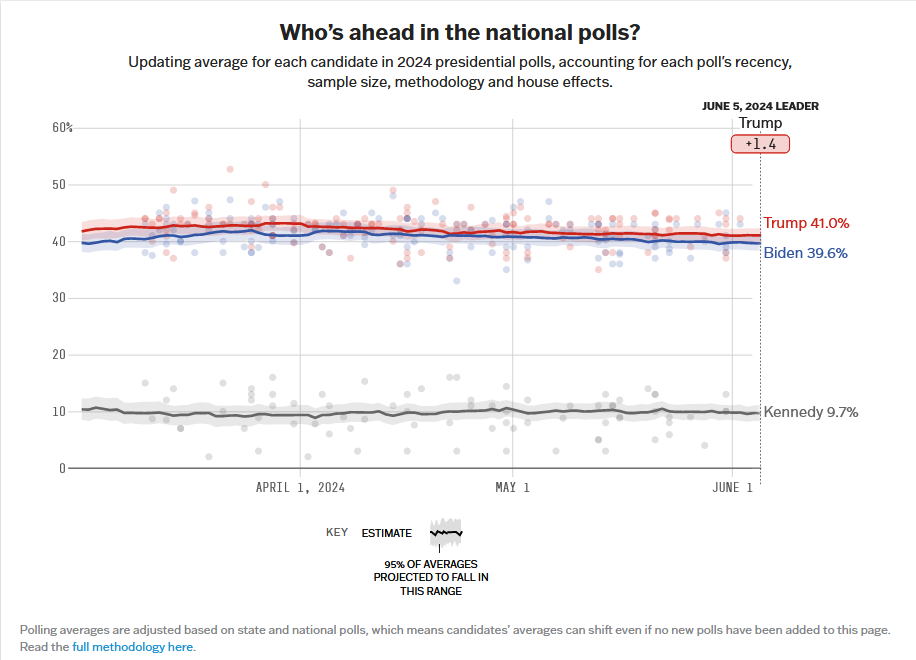
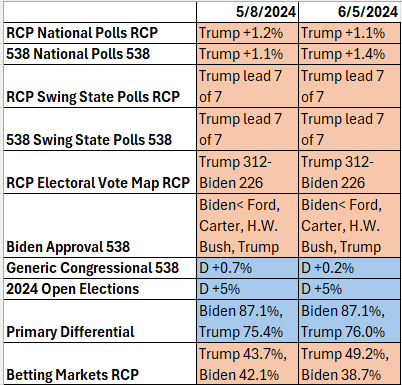
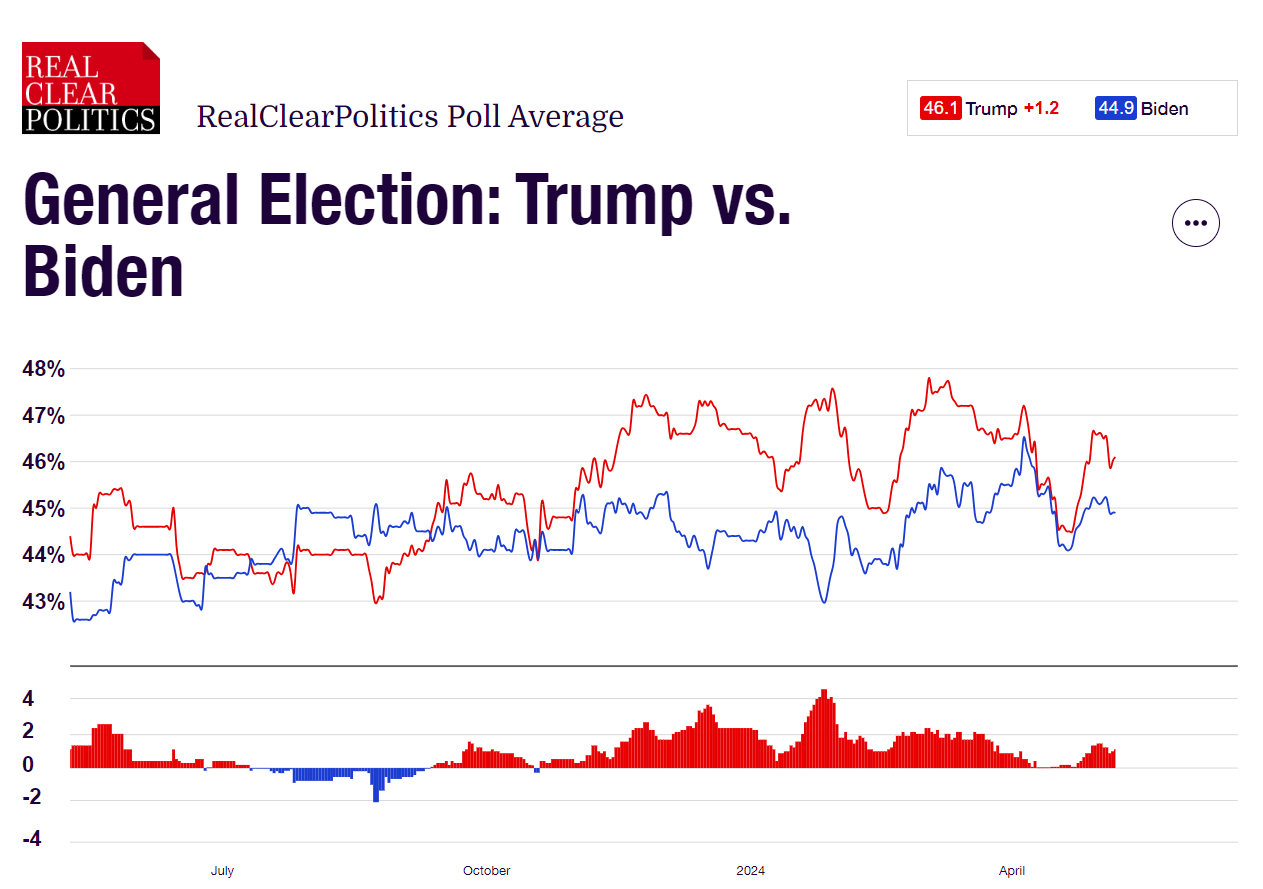
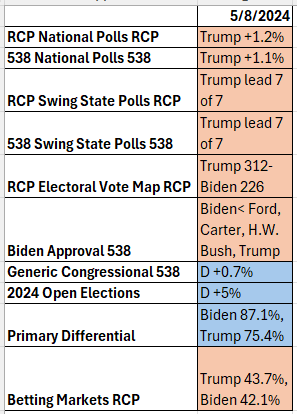
Trump’s lead in the RealClearPolitics poll average has narrowed over the last four days from 0.4% to 0.1%. Over at 538, with it’s more rigorous methodology of weighting polls according to the pollster’s track record of reliability and partisan tilt, Harris remains ahead, but her lead is down from 1.4% to 1% over the past four days:

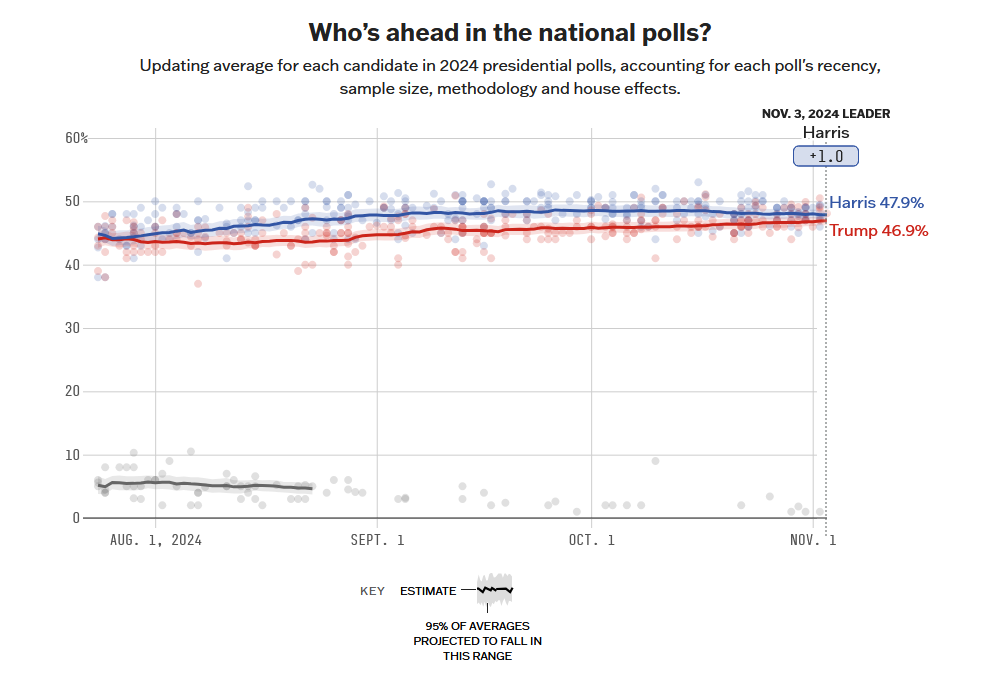
That’s a bit of a mixed picture. It’s also well within the standard polling error of +/-3%. The other thing we can observe is that the 538 Harris lead is below the point- somewhere in the neighborhood of 2% to 3%- where a Democratic national lead doesn’t necessarily translate into an Electoral College lead. But, between the margin of error and the unknowns of how late deciders will break (the last two elections they have gone disproportionately to Trump, but there have been many other elections where they break toward the Democratic candidate, or go roughly equally to both sides) she definitely could get there.
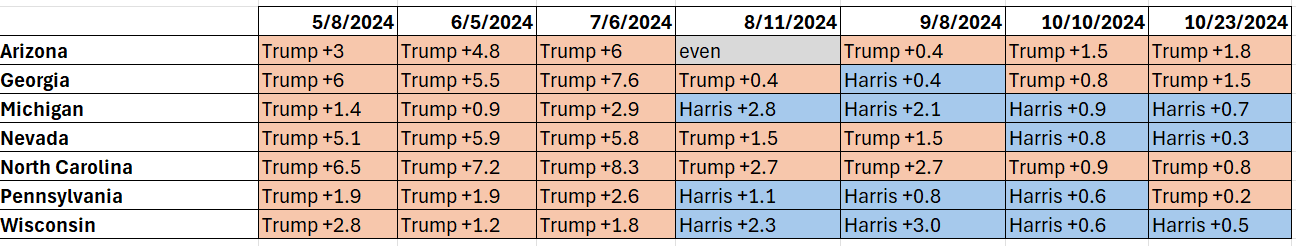
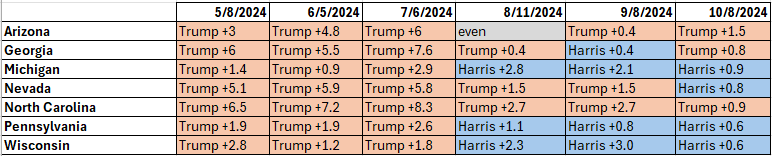
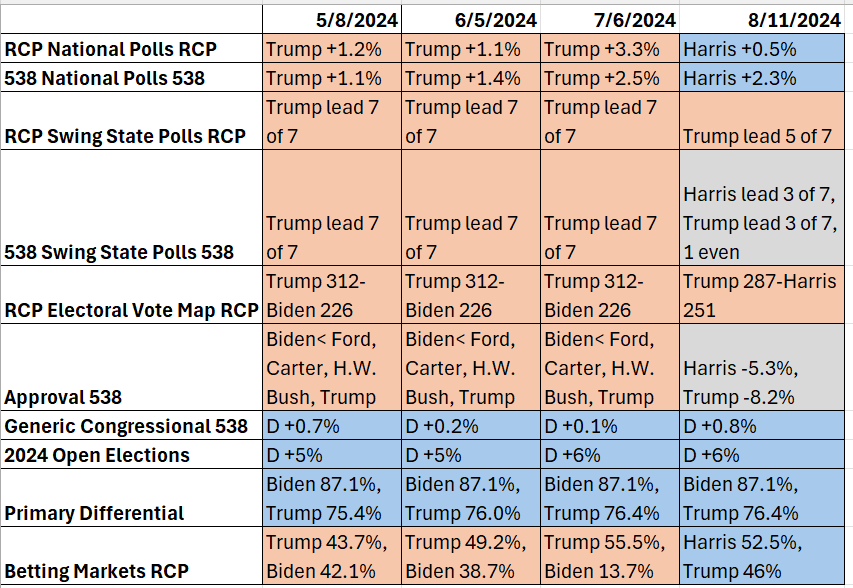
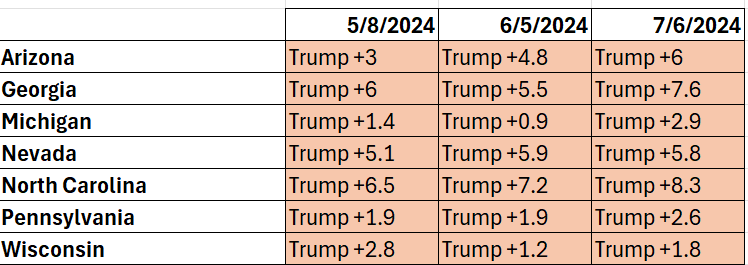
Can we get a clearer picture by looking at the states? For the 7 swing states, RCP continues to show Trump leading in 5 of 7 states. 538, with it’s more reliable methodology, now shows the same, with Nevada going from a tie four days ago to a 0.4% Trump lead. Other than that, it’s also a scattered picture- Trump’s leads in Arizona and North Carolina are up from four days ago, his leads in Georgia and Pennsylvania are down, and Harris has bumped up slightly in Wisconsin and down slightly in Michigan. All of these changes are so small though that they could be statistical noise. And, crucially, every swing state margin remains less than the polls margins of error, and the same 4 of 7 states from four days ago remain separated by less than 1%:

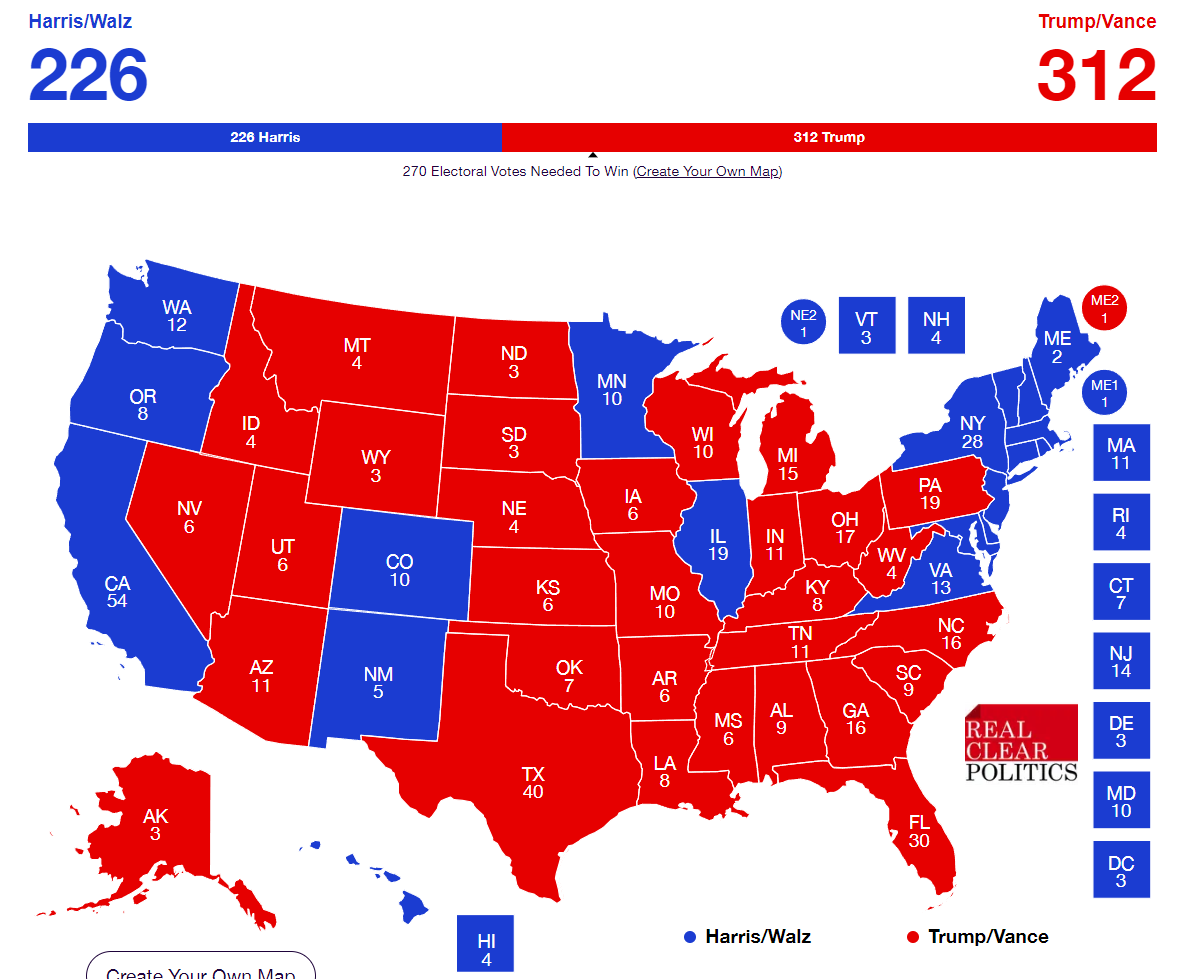
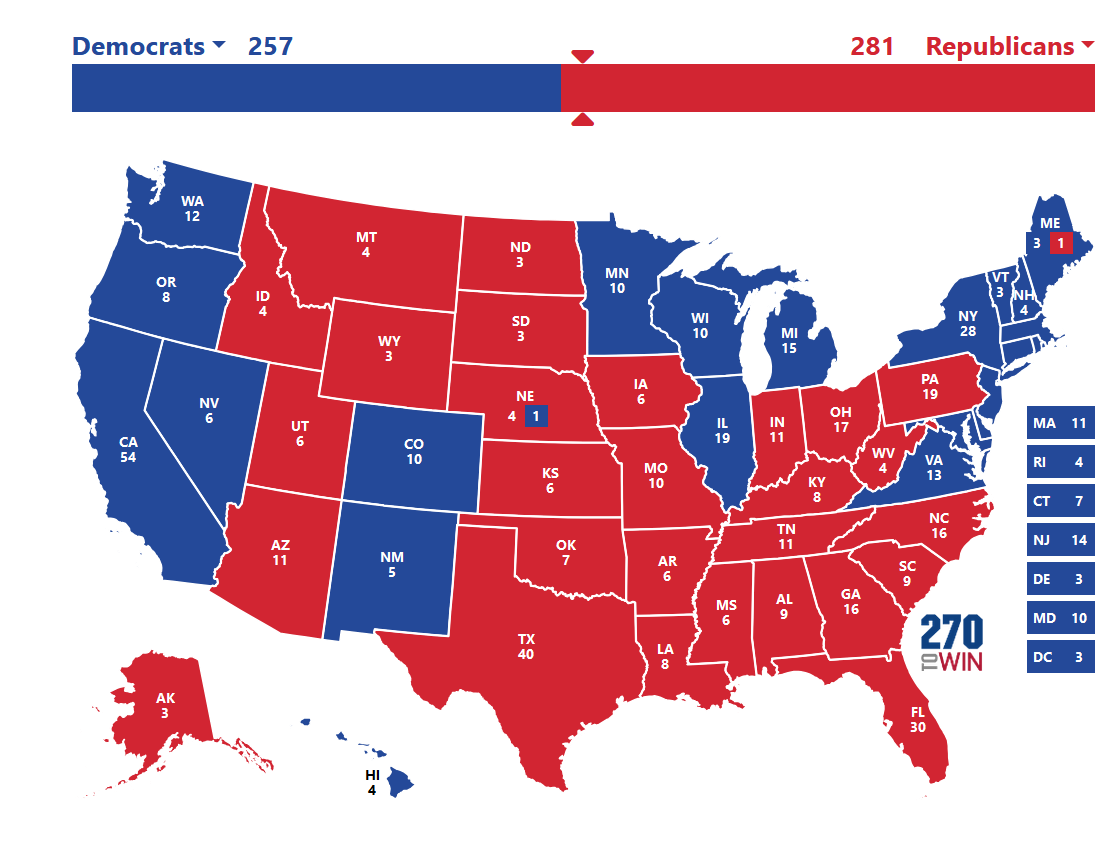
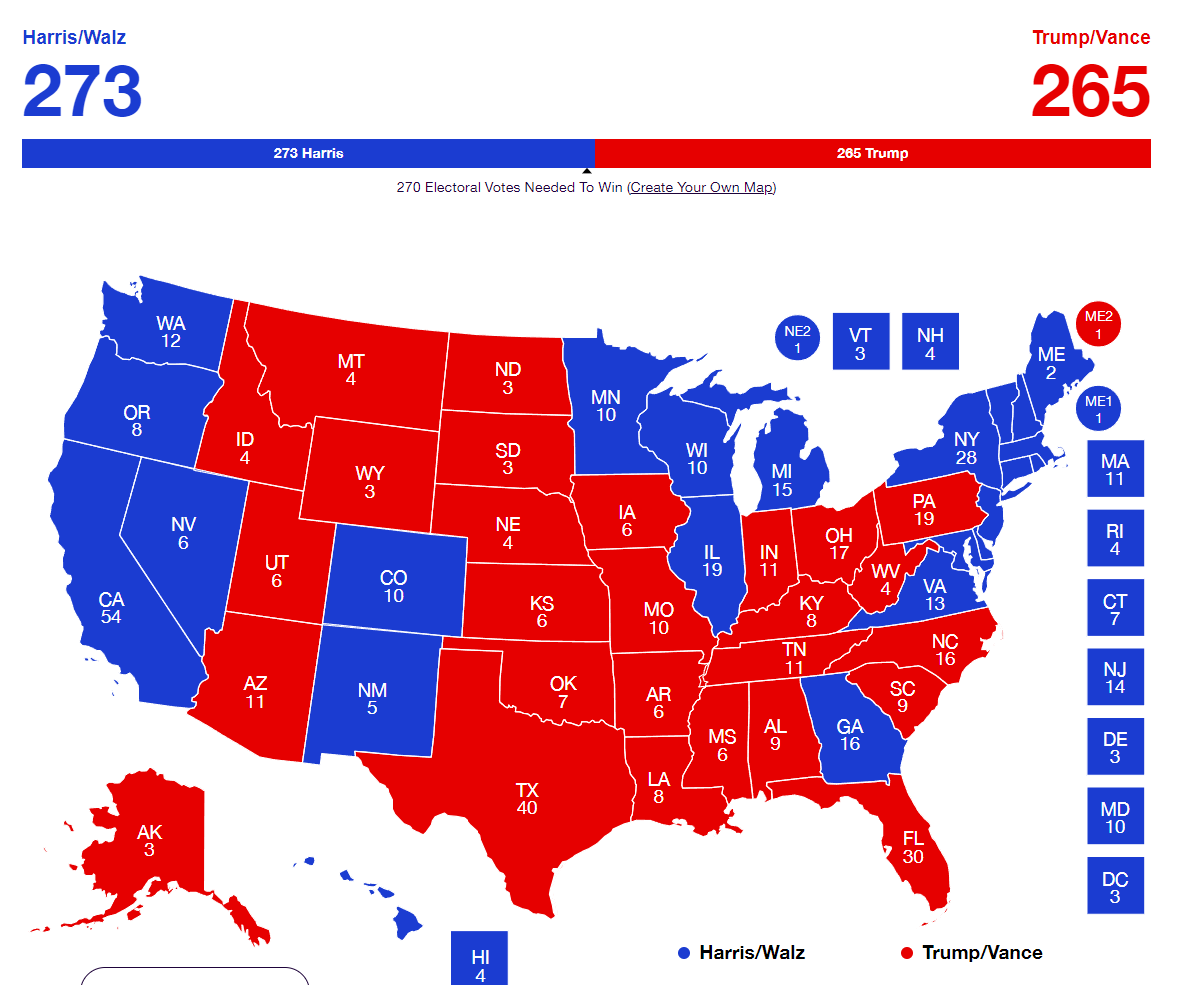
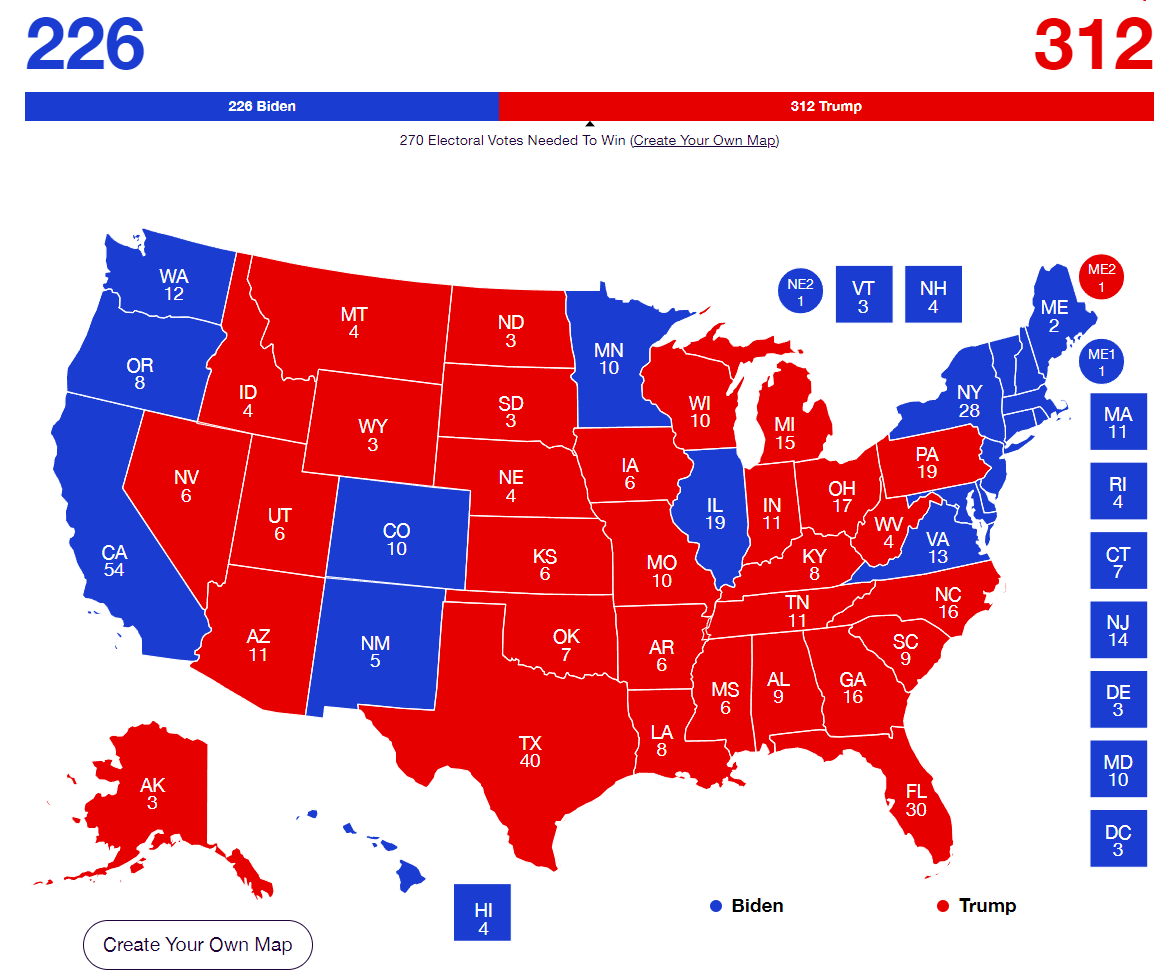
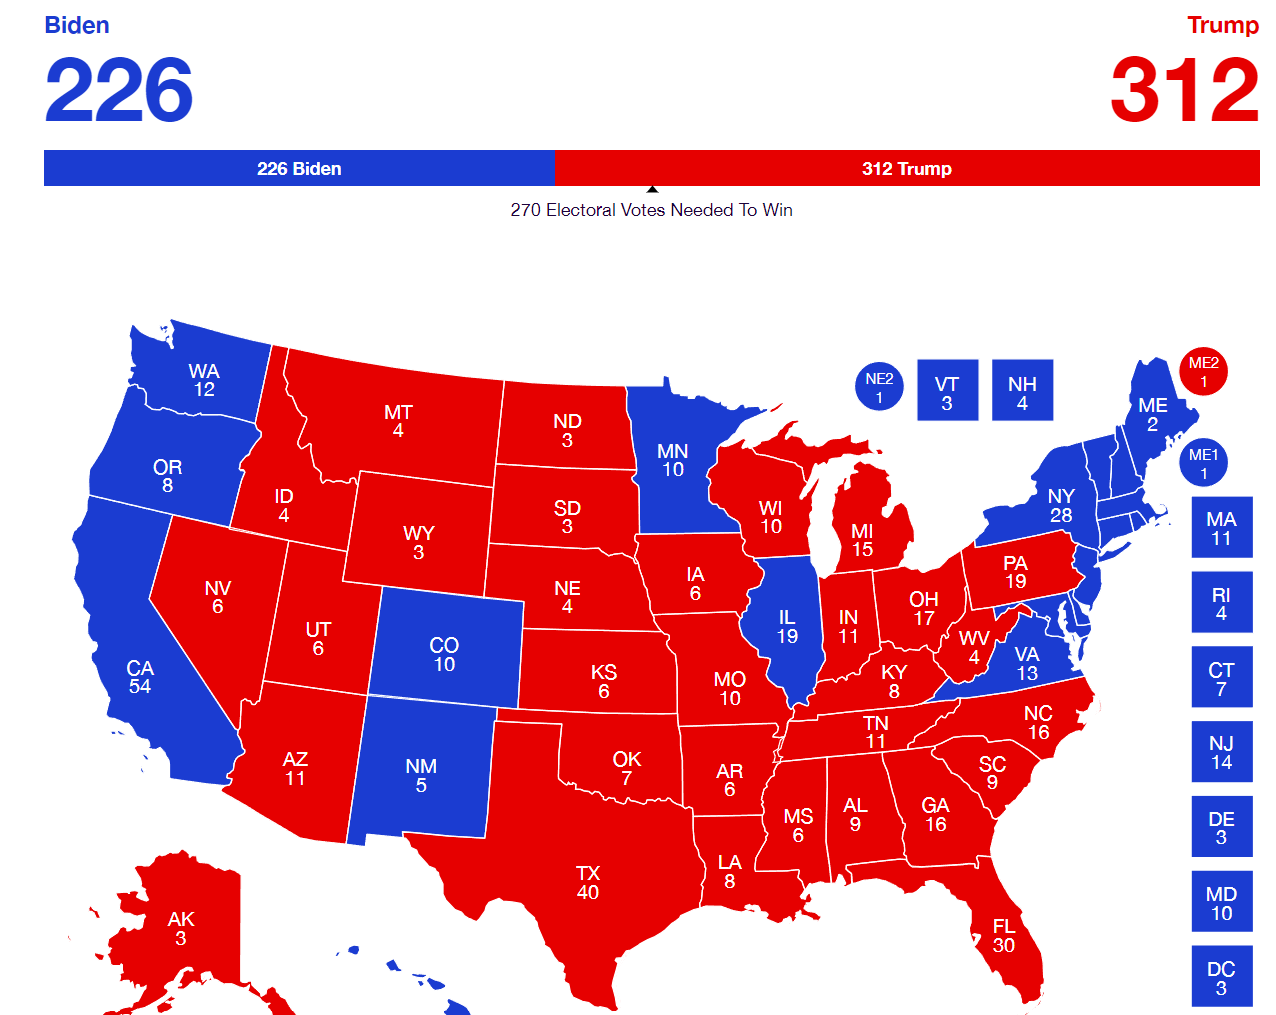
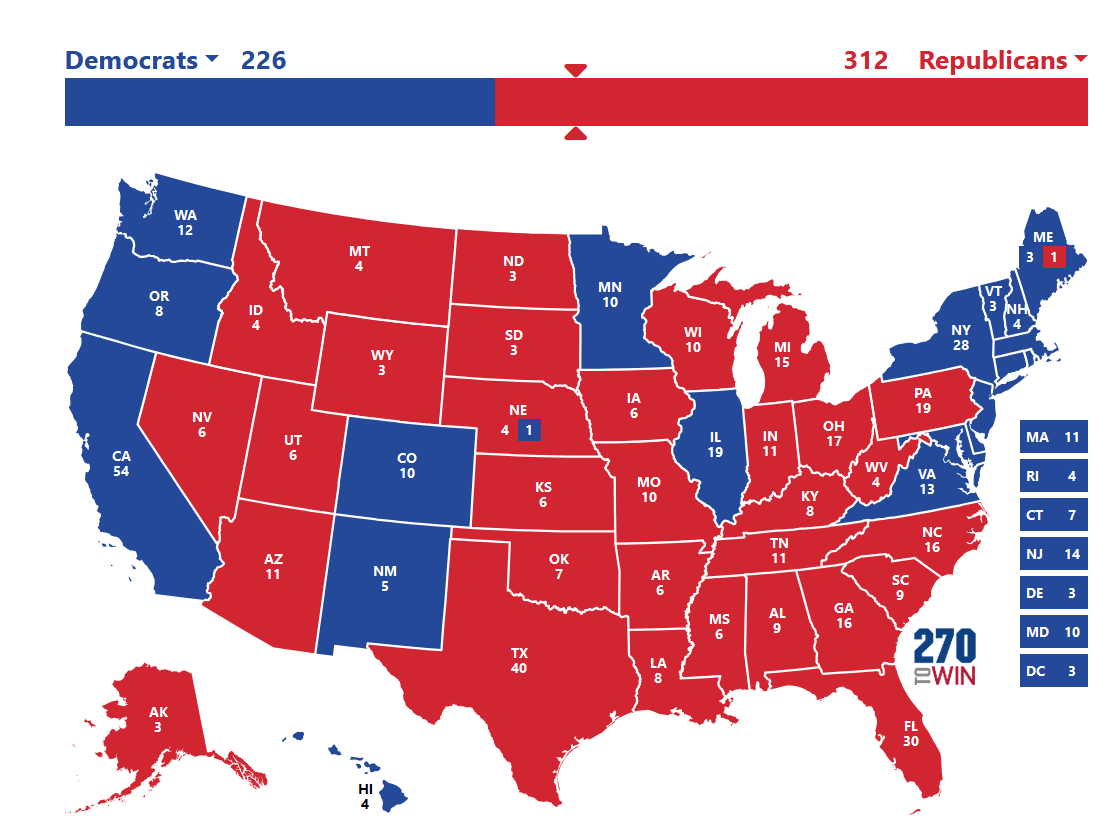
So what does that add up to? RCP still has the same map as four days ago (but note that their Pennsylvania average only has Trump ahead there by 0.3%, so if that state changed it would flip things to 270-268):

538’s state polls now would result in the same electoral map as above, with the exact same Pennsylvania proviso as above (their average only has Trump ahead by 0.2% in Pennsylvania).
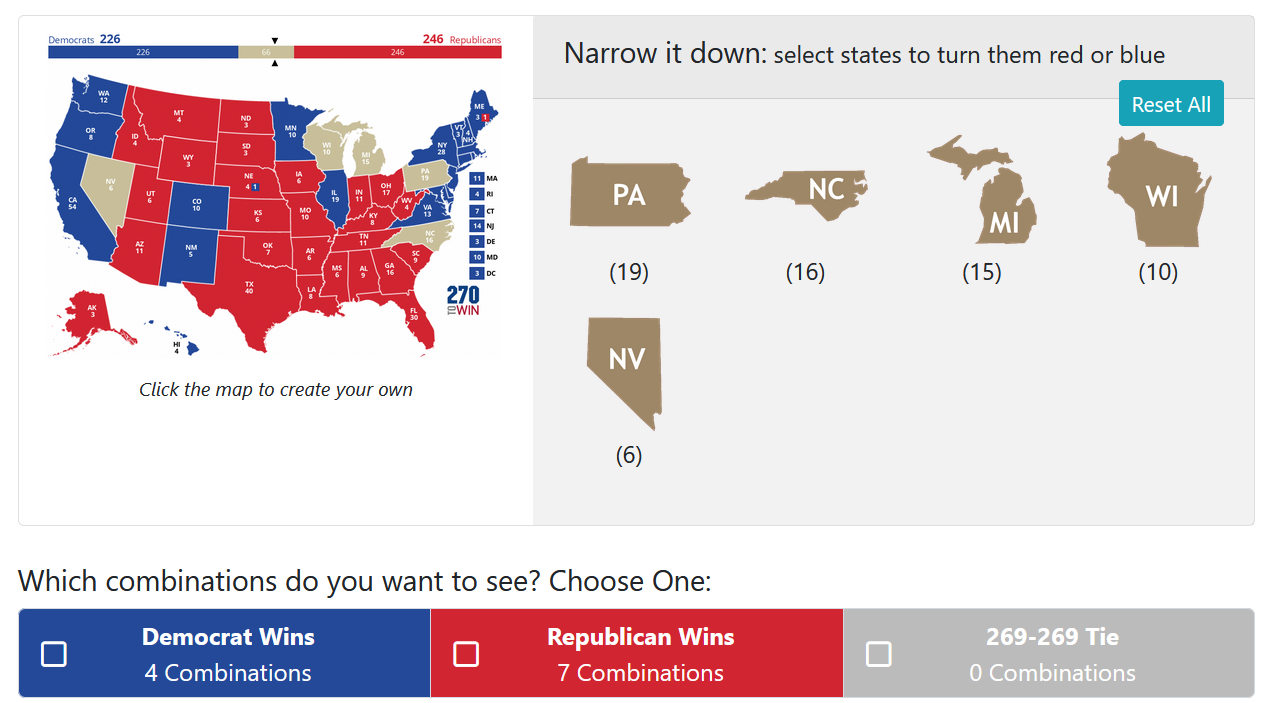
And so, what was true four days ago remains true- with four states separated by less than 1%, and all seven below the margin of error, it wouldn’t be a major surprise to see either candidate win any given state. It would even be consistent with these numbers to see either Harris or Trump win all seven. It’s one thing to say that, but visually it’s kind of startling when you realize that both these outcomes would be entirely consistent with current polling:

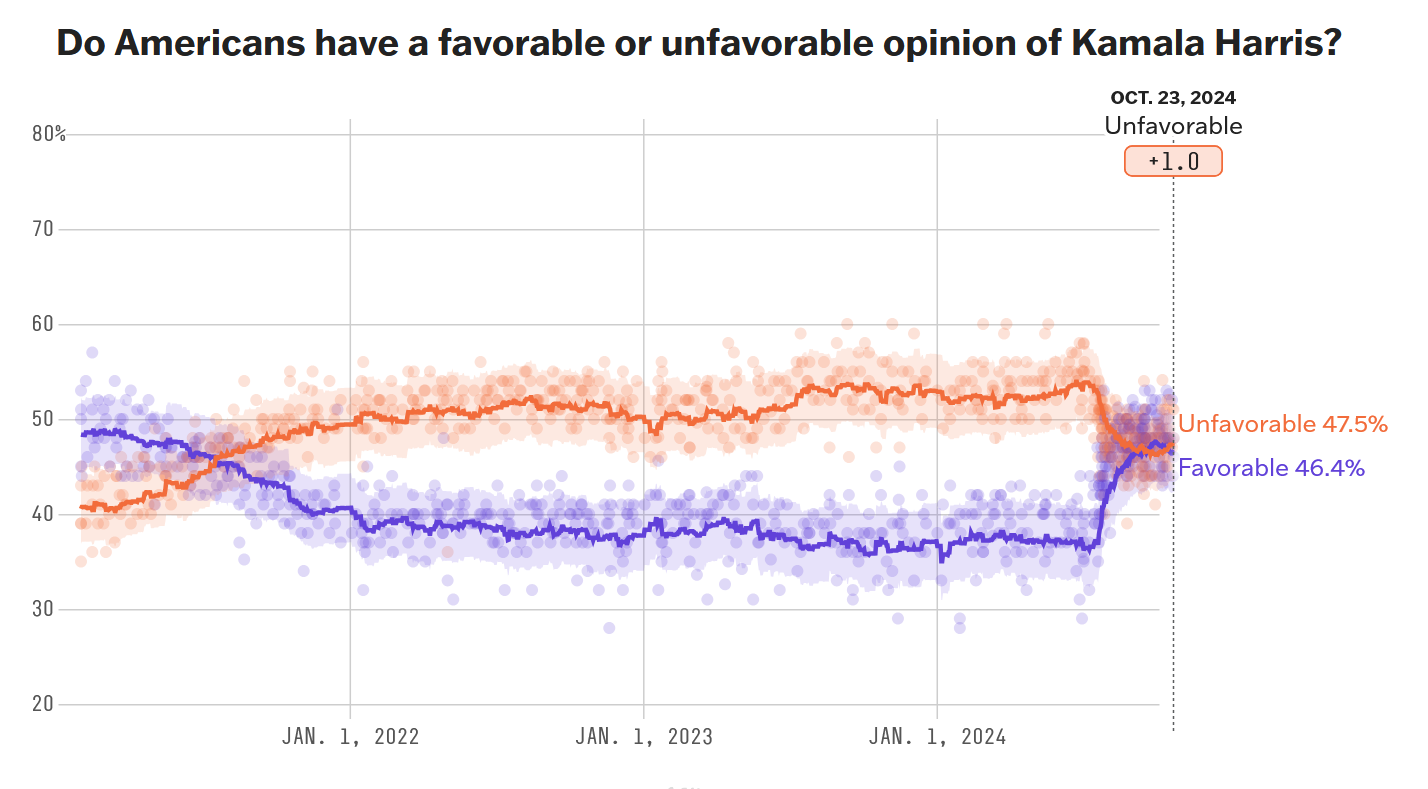
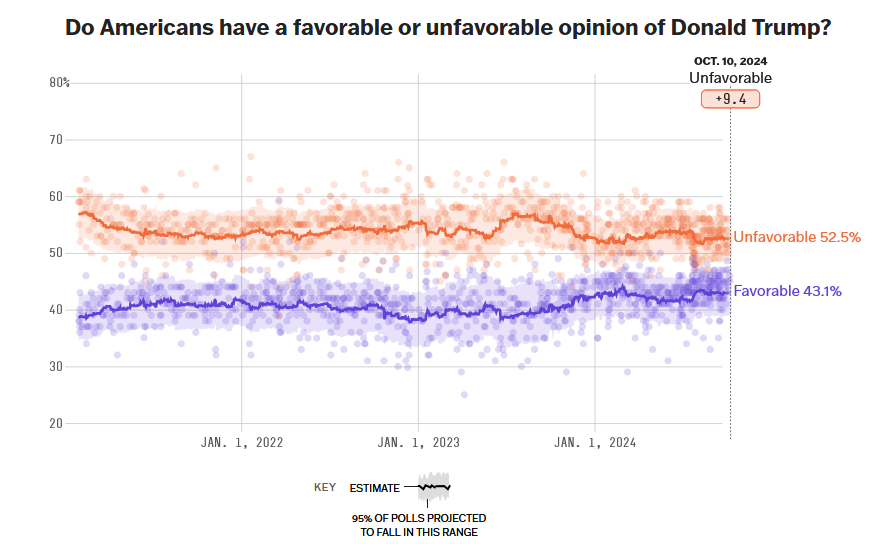
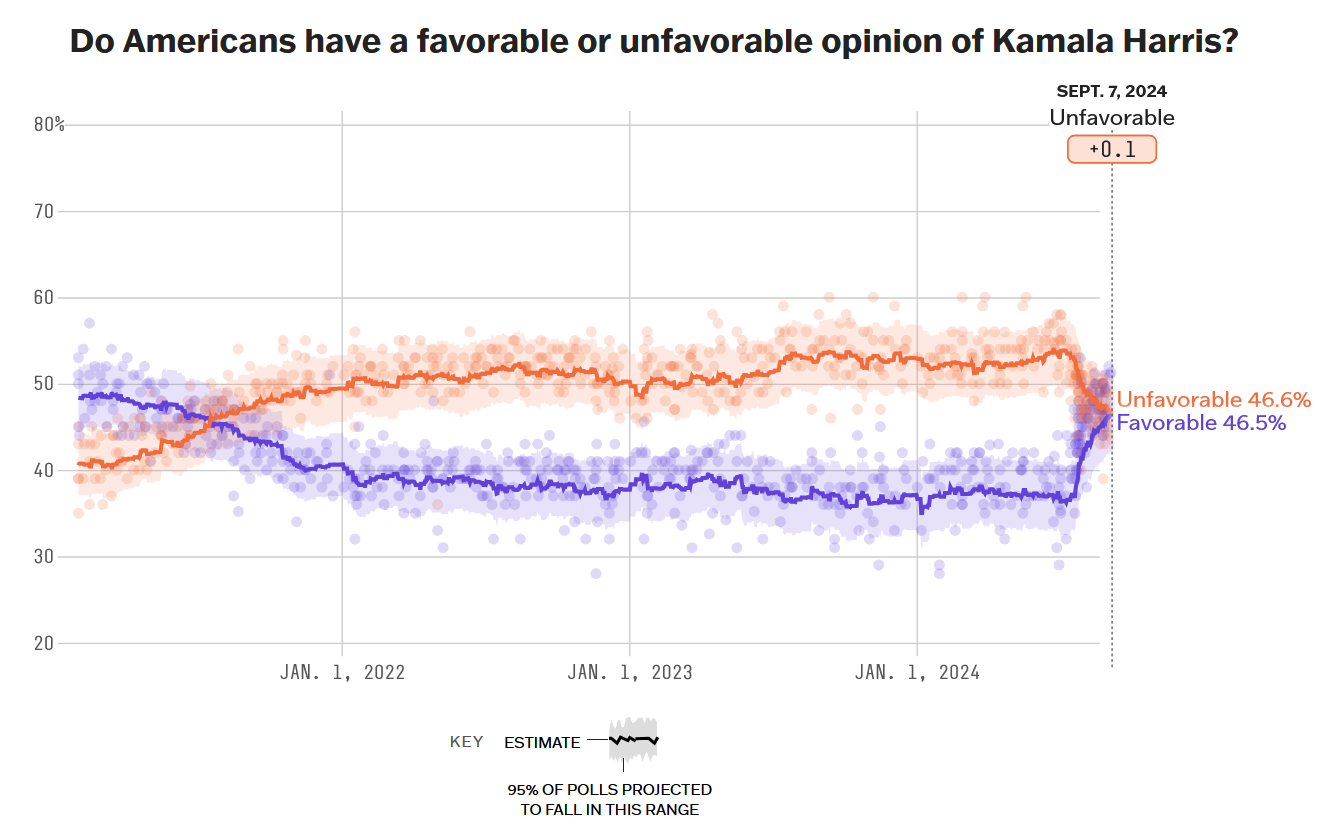
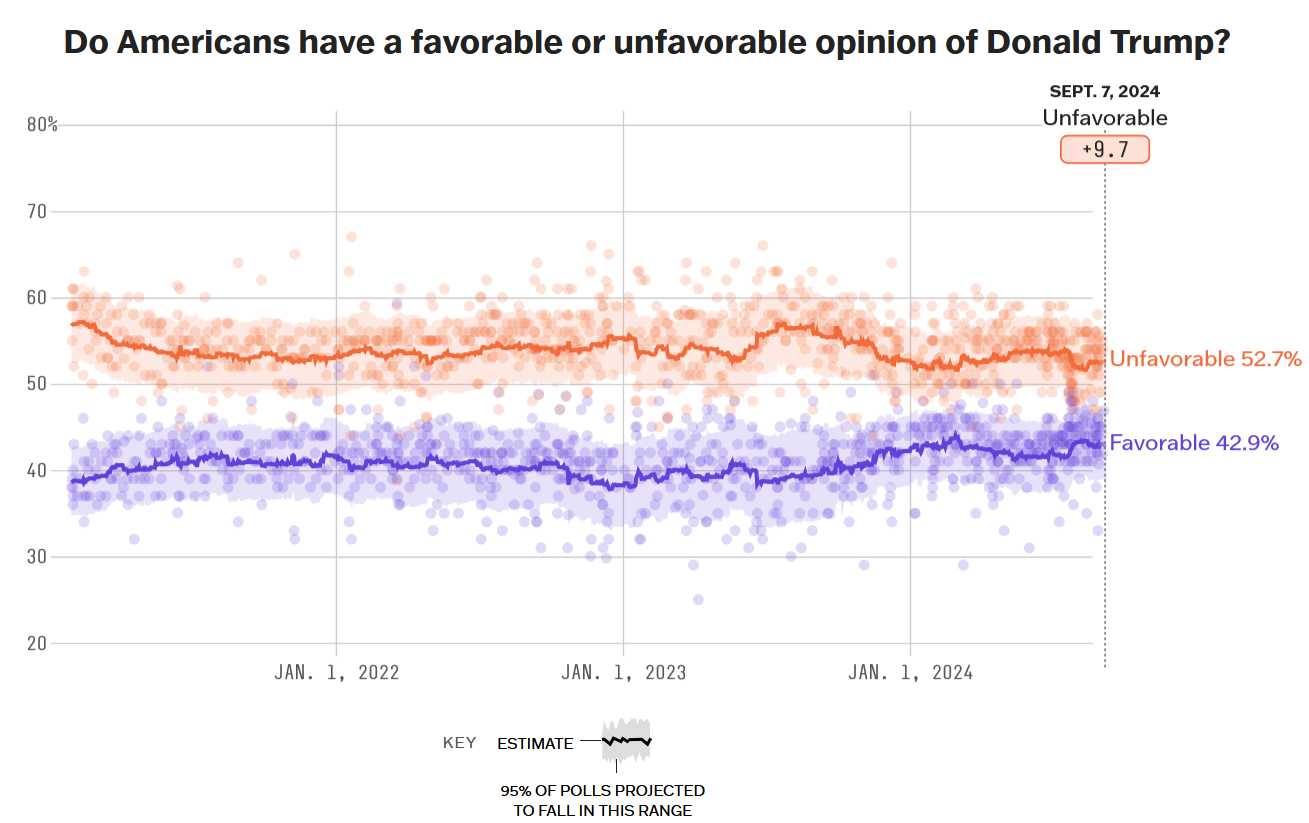
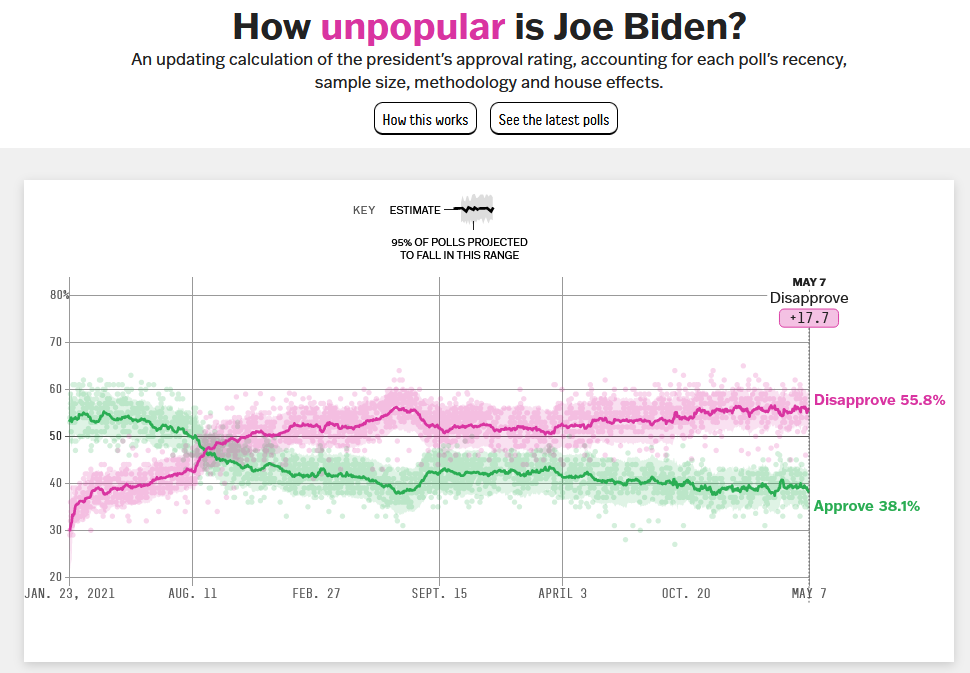
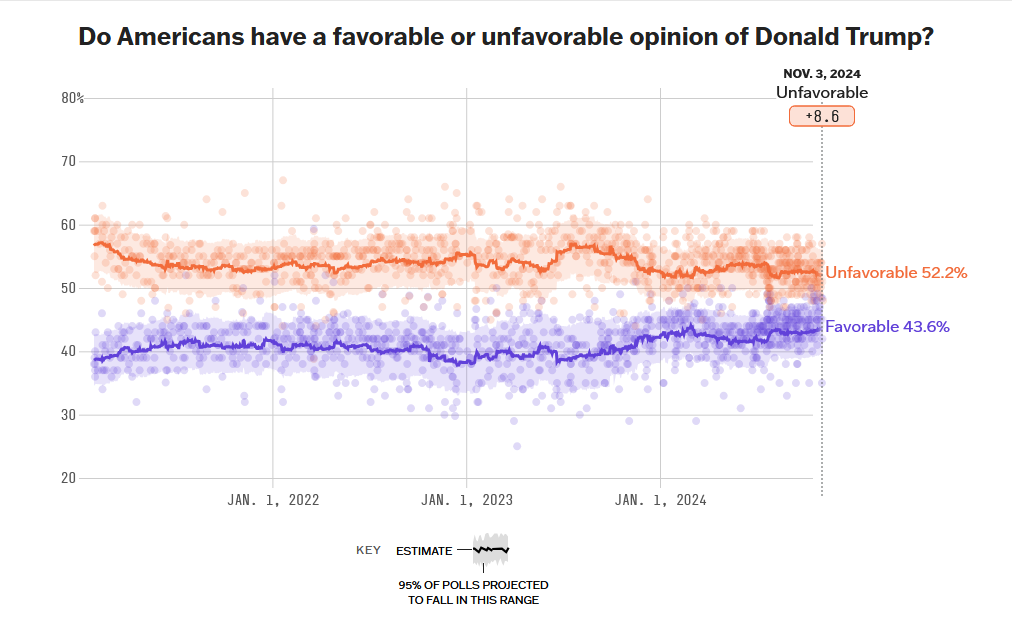
Approval ratings, which are another kind of stand in for preference, still show an edge for Harris, but her net negatives have grown from 1.5% four days ago to 2% today, while Trump’s net negative has improved by 0.4%. Still advantage Harris, but getting to the point where it’s not really a meaningful difference:

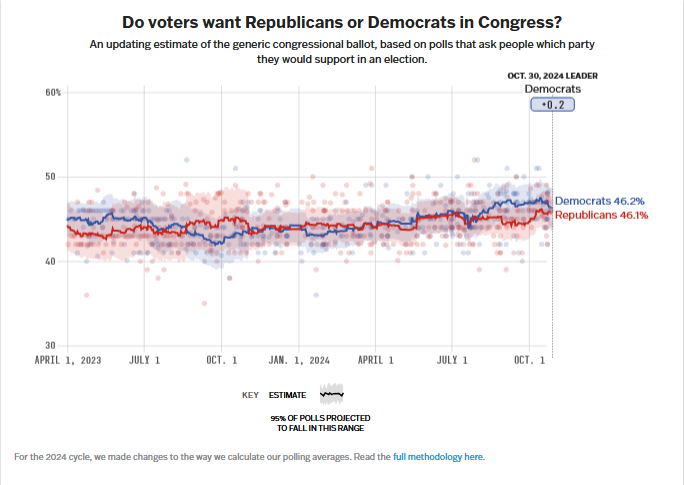
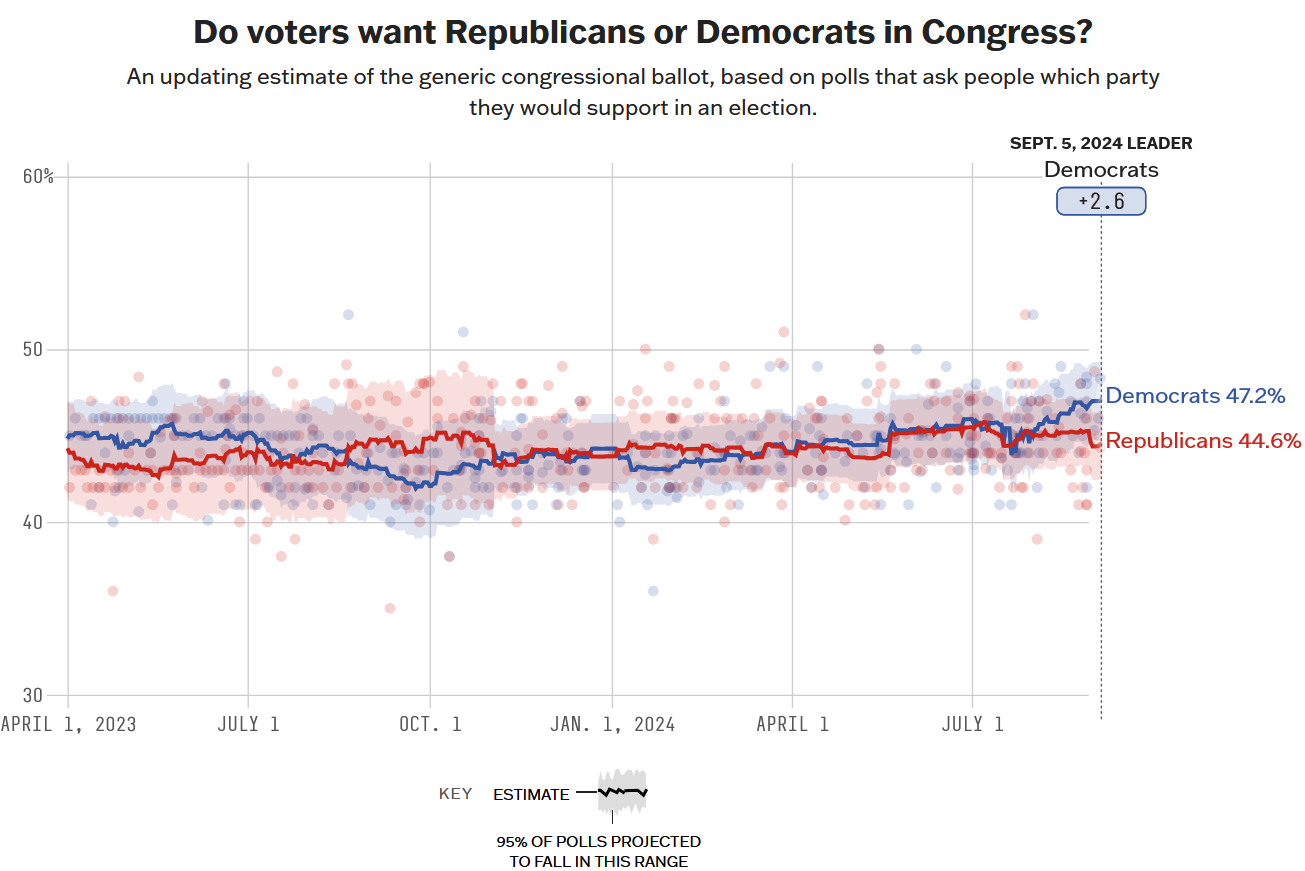
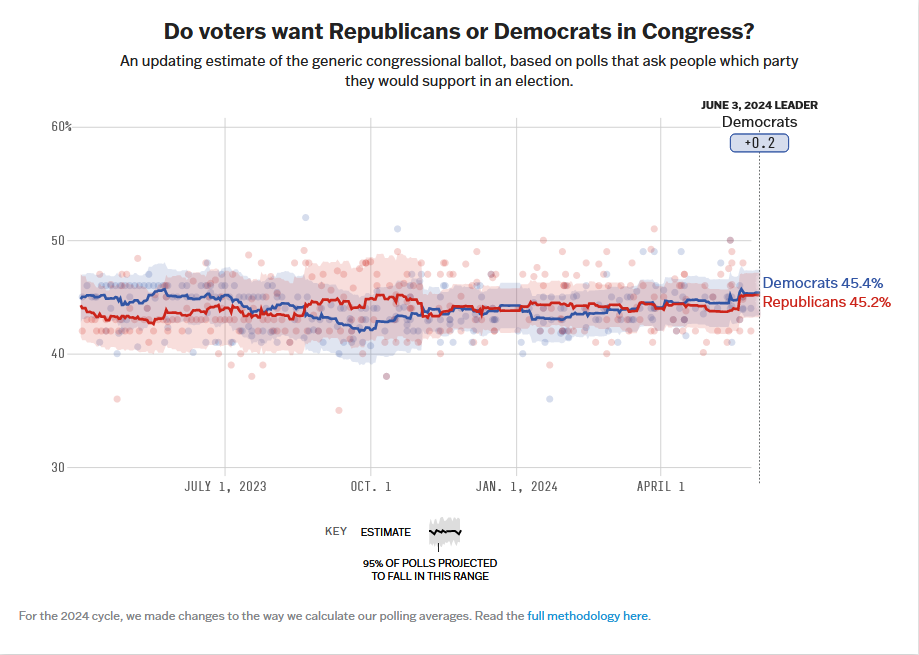
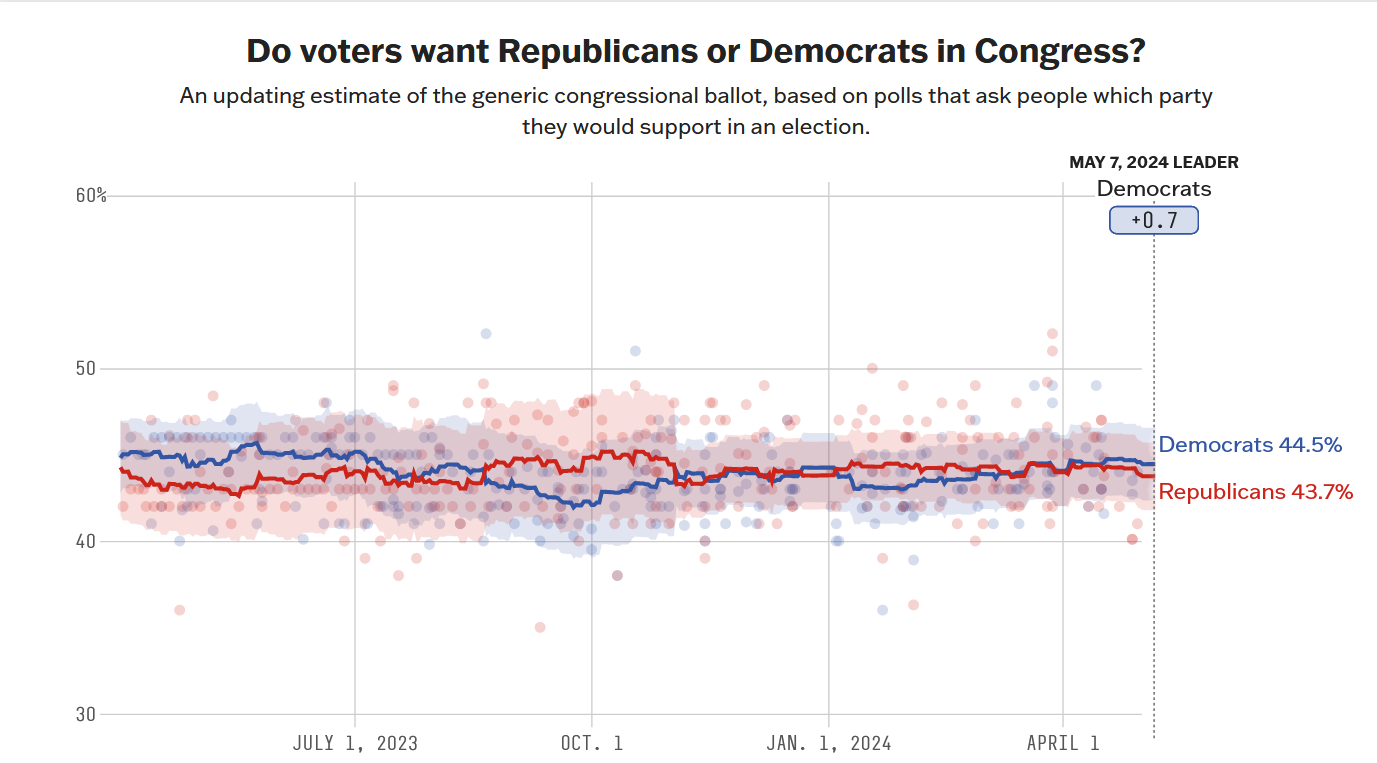
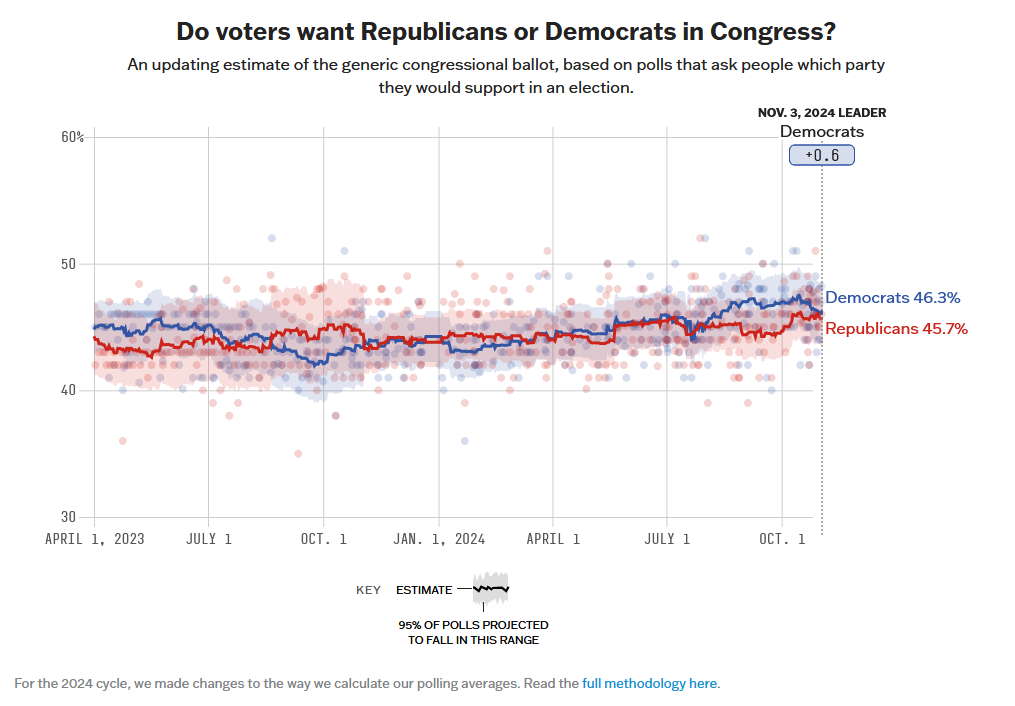
In some good news for Democrats as a whole, their Congressional preference edge has expanded a little from four days ago:
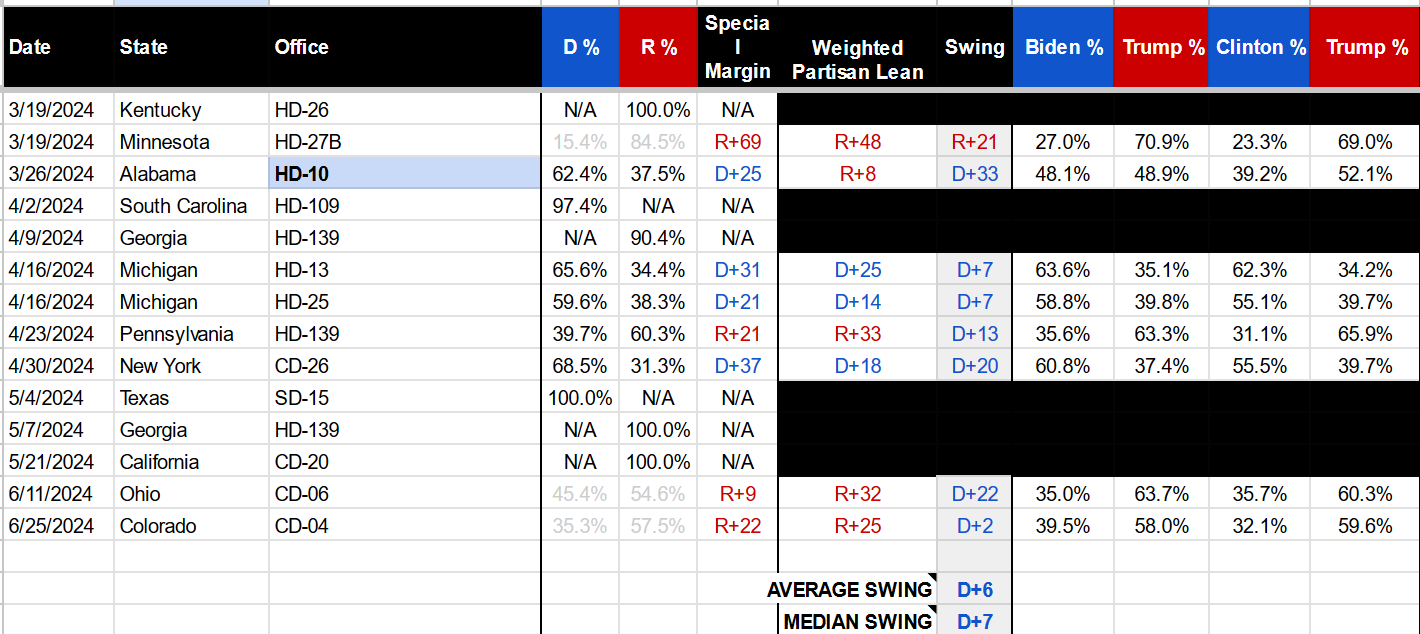
No change in this, but a significant indication of overall strength for Democrats remains that, through 100 special elections over the past two years, the party has outperformed by an average of 6% against the partisan lean of the races in question (per a spreadsheet compiled by Nathaniel Rakich of 538):

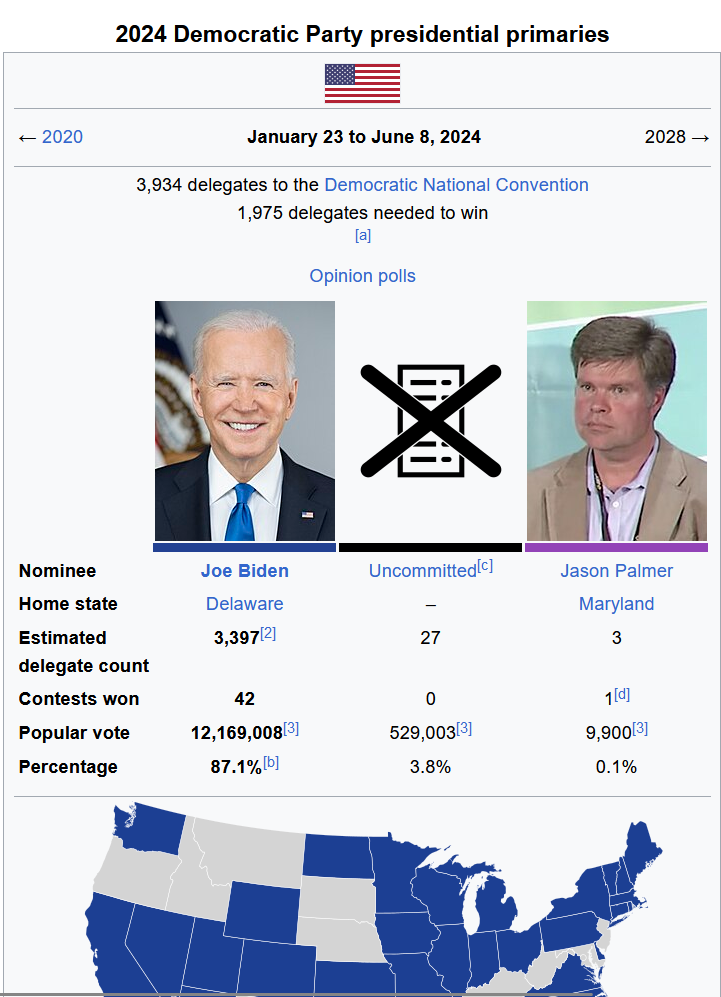
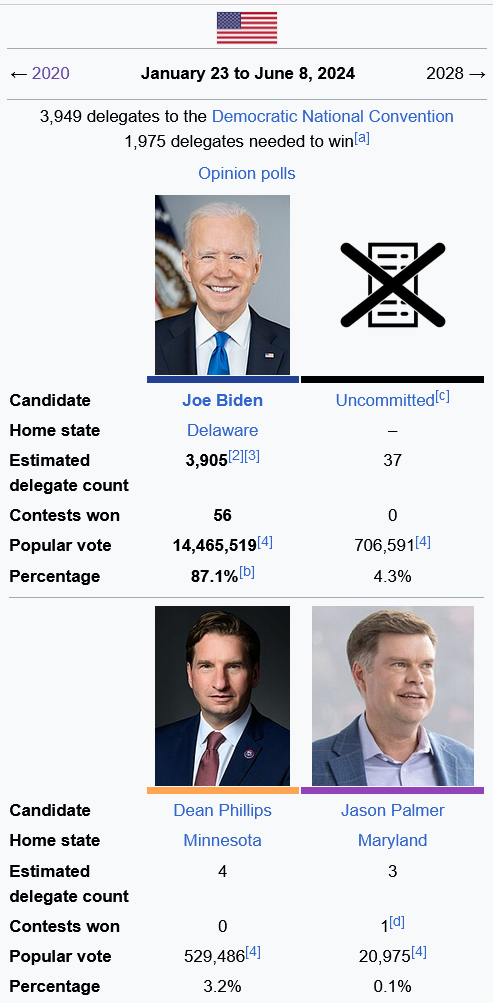
There’s also no change in this indicator, but it remains true that Biden’s percentage in Democratic primaries was ahead of Trump’s in Republican primaries, indicating that Republicans had comparatively more wavering partisan supporters to bring home for their nominee:
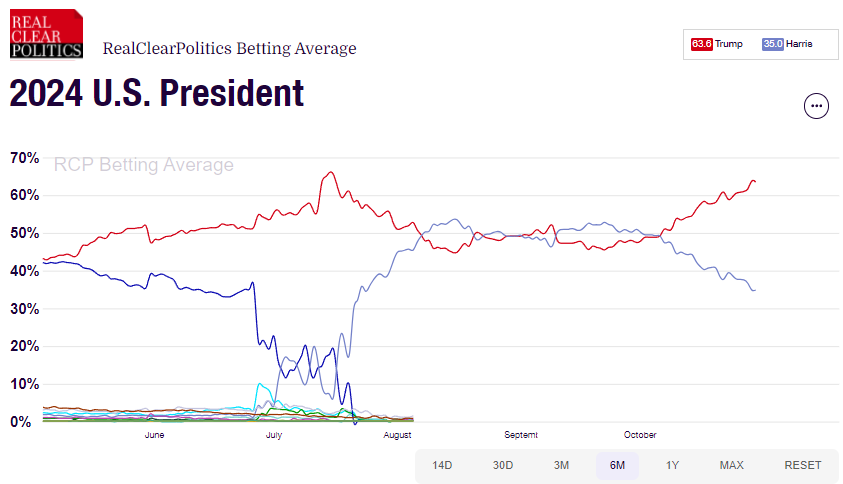
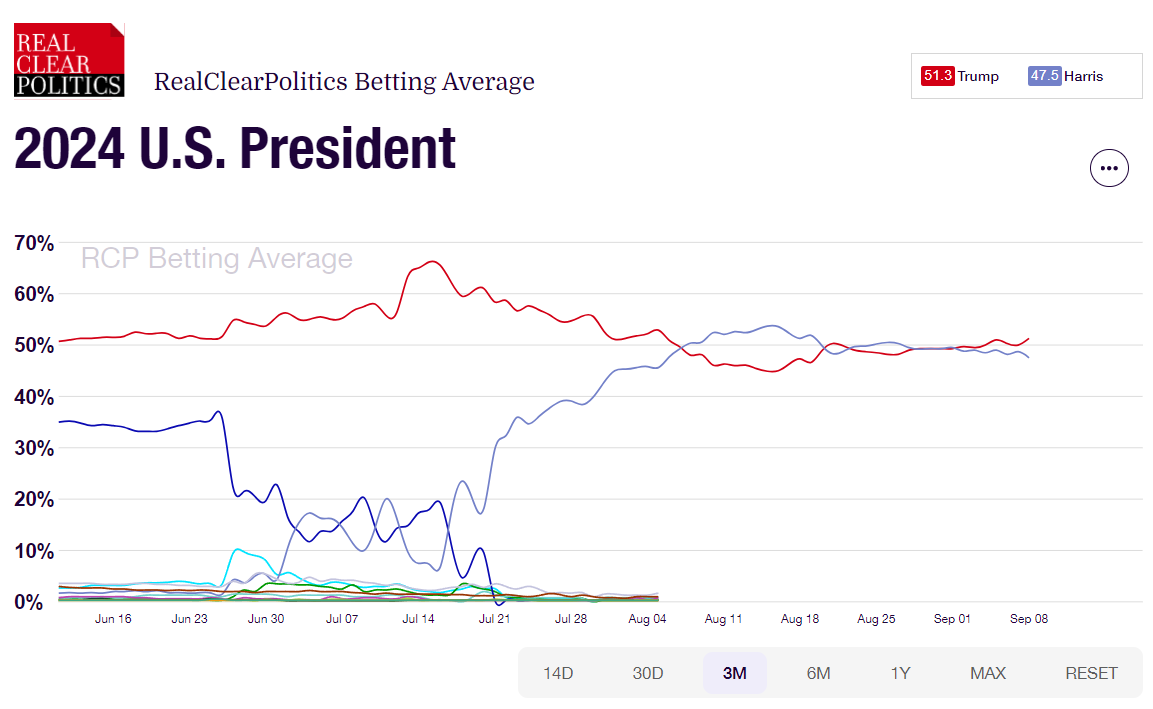
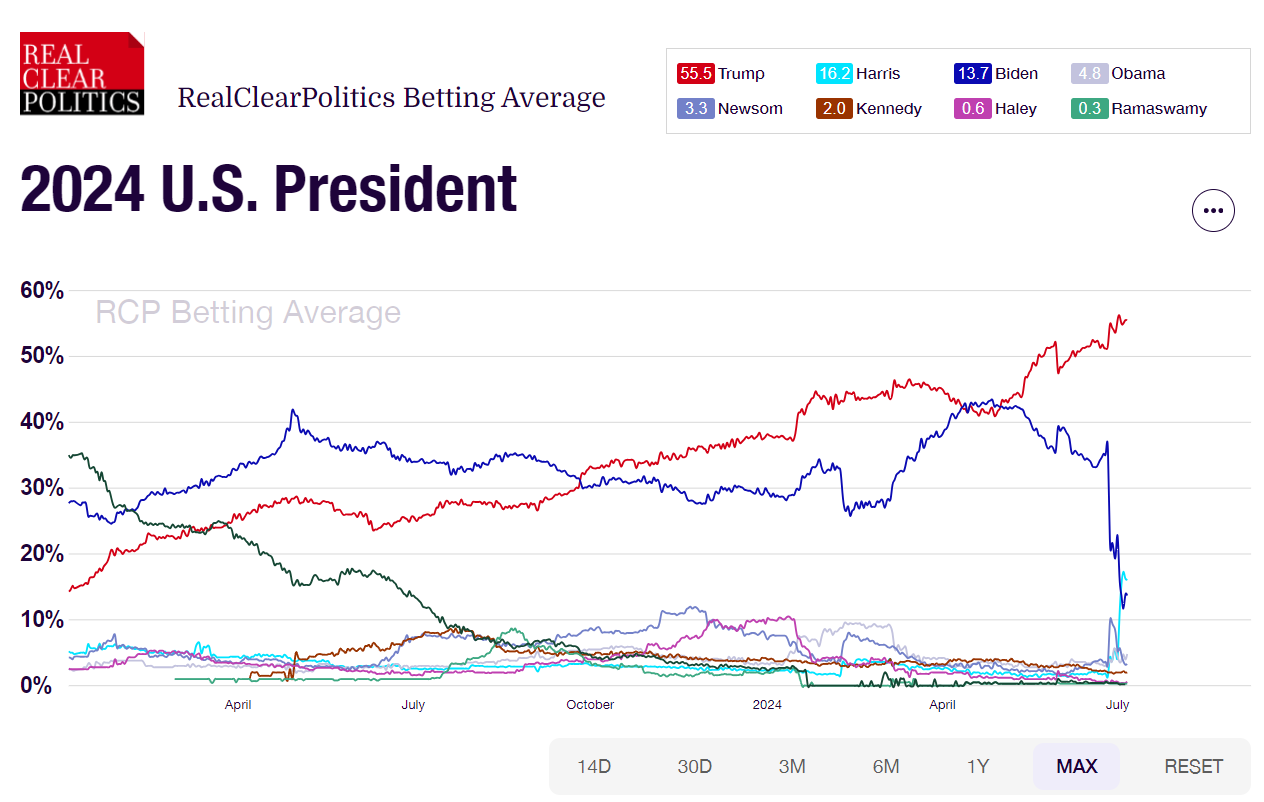
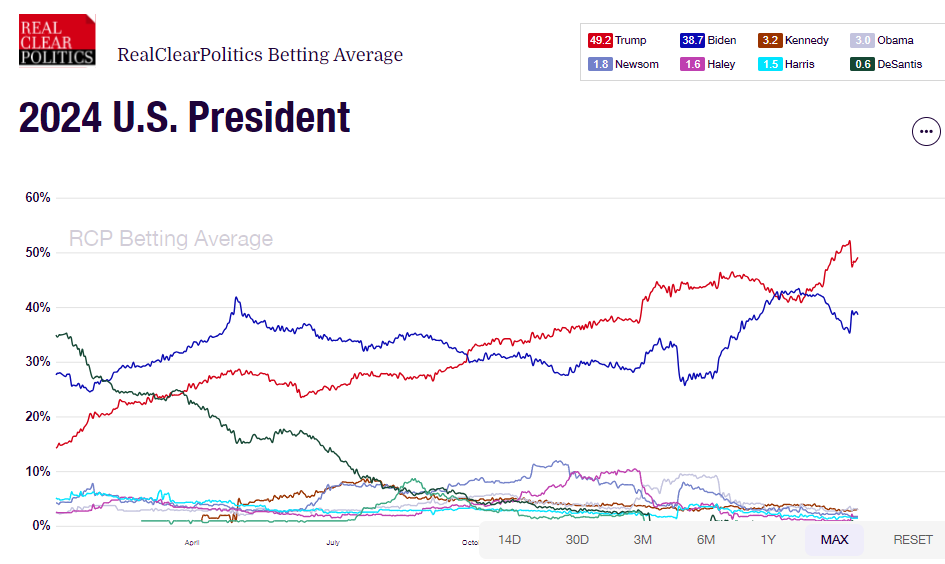
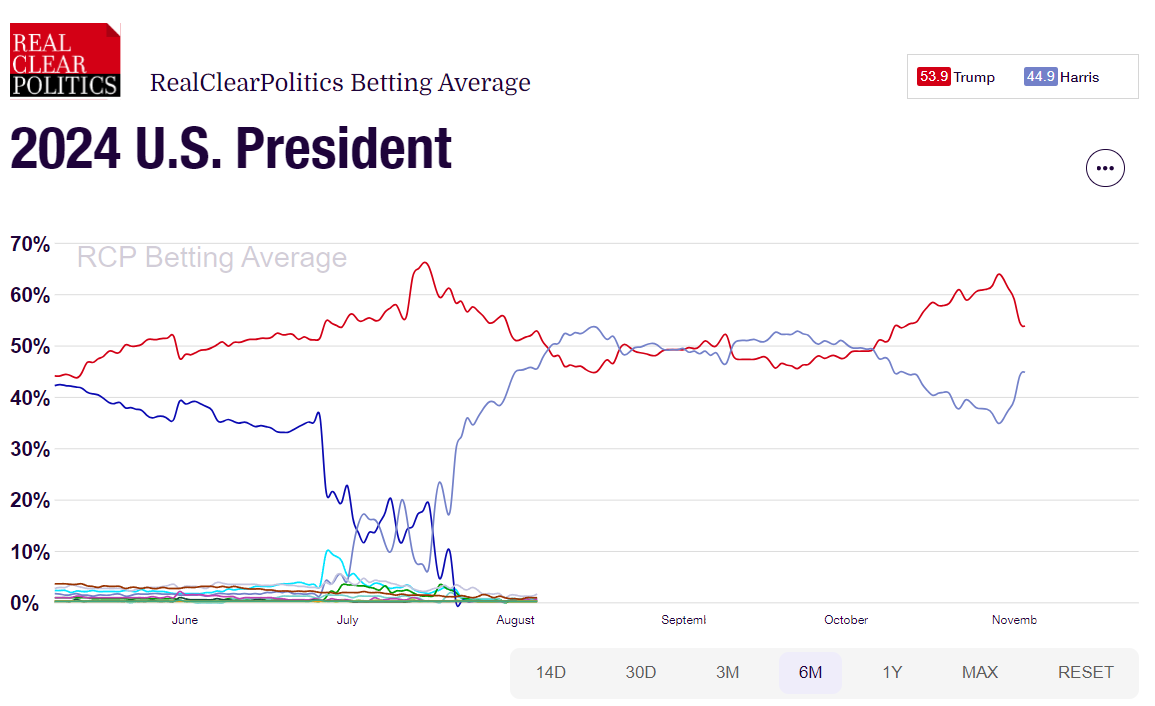
The one thing that has really shifted over the last four days is the betting markets, where Trump’s chances went down by 10% and Harris’s correspondingly rose. I think they spotted the arbitrage exposure I talked about in the last post and are hedging their bets (every pun intended):
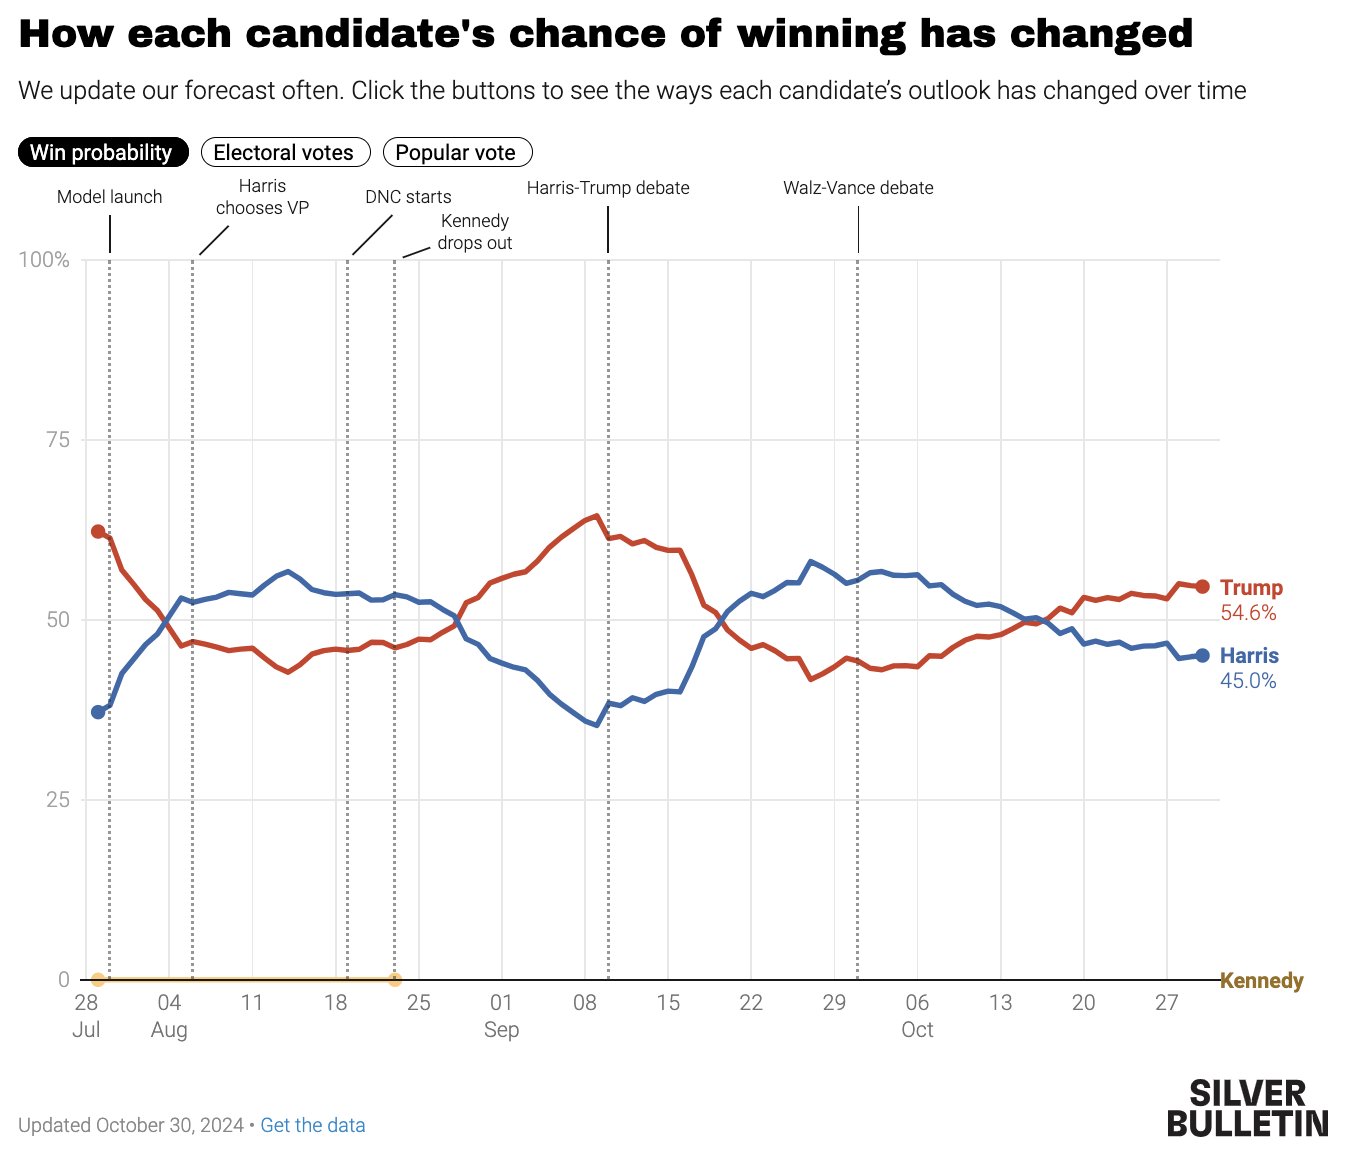
Perhaps unsurprisingly, the numbers the betting markets are converging on are pretty close to where the forecast modelers have ended up. 538’s forecast model is not far off from 50/50:

And 538’s now solo founder Nate Silver, who has his model behind a paywall but gives frequent updates, is even closer to 50/50:

We talked four days ago about doing a map that leaves blank the four states that are within 1%. Since those states haven’t changed, the results are the same- there is one path by which Harris could get there, winning all three of Michigan, Pennsylvania, and Wisconsin. Trump would win with any one of the three:

This is probably a good place to remind ourselves of something both 538 and Silver repeat often, that just because the forecast models are close, it doesn’t mean the outcome will be. To understand why, a quick look at the 538 model’s results is helpful. Though the overall distribution of outcomes equates to a 53% chance of Trump winning, the single most common way he does it in 1,000 runs of the model is to win all seven swing states (the big red spike on the right). Similarly, Harris has an aggregate 46% chance of winning over 1,000 runs of the model. But she’s as likely to do it with 286, 308 or 319 electoral votes as she is to squeak by (the four highest blue spikes on the left):

Overall, looking at the indicators, it feels to me like a just about even mix of signs of closing momentum towards Harris and Trump. As mentioned last time, there are some reasons to think that things could be better for Harris than the polls indicate:
- In 100 special elections over the past two years, Democrats have consistently done better by several percentage points than the dynamics of the races would indicate.
- Harris is running behind Democratic Senate candidates in several swing states and, other things being equal, it would be surprising if her numbers didn’t end up equalizing a little more there.
- Democratic voters show an enthusiasm edge over Republican voters in recent surveys (which is usually, but not always, correlated with turnout).
- As might be expected from the item above, there is every sign that the Democrats have a stronger ground game in this campaign (things like number of field offices, volunteers making calls and knocking on doors, turnout for rallies, etc.).
- Pollsters may have bent over backwards to correct the sampling models that had them systemically underestimating Trump supporters in 2016 and 2020, and may now be systemically underestimating Harris’s support.
- And, in a possible indication of this, the uncannily accurate Ann Selzer released her final Iowa poll over the weekend, and it showed Harris ahead there by 4%. The point is not that she will or won’t win Iowa, but if she really is doing much better there than expected, she’s probably doing much better in lots of places.
These are all logical takes, supported by empirical data, but the logic here cuts both ways. If polls are underestimating Harris by a few percent, she could be headed for a comfortable win. On the other hand, if they’re still underestimating Trump the way they did the last two cycles, he could be headed for a blowout. Or, things could be exactly as they appear, and a handful of votes in a few key states (with Pennsylvania being the most likely tipping point) could see either candidate squeak by.
My best advice remains what it was four days ago- follow some of the most empirically grounded commentators on the lead-up to election night (and on election night itself). Axios had a good round-up of suggested follows:
“Pick a few trustworthy accounts rather than gorging on whatever pops up.
Jon Ralston (@RalstonReports) is your man in Nevada … Garrett Archer (@Garrett_Archer) in Arizona … Greg Bluestein (@bluestein) and the Atlanta Journal-Constitution crew in Georgia.
Dave Wasserman of Cook Political Report (@redistrict) is an essential follow if you want live play-by-play of crucial counties, as are the two Nates — @NateSilver538 and @Nate_Cohn.”
And the good folks at Electoral-Vote.com had some sage advice on where election night results could indicate a developing Blue or Red Wave (as opposed to a 50-50 muddle where it would take several days for the winner to become apparent):
“Many people have already voted but, due to various state laws, we are unlikely to know the winner of the presidential election on Nov. 5. Maybe not even on Nov. 6 if it really is as close as the polls say it is. Much of the problem is due to Republican-controlled state legislatures that want the election to devolve into chaos to provide cover for Donald Trump if he tries to claim victory on Nov. 5 and is then ultimately defeated. The biggest issue is whether absentee ballots can be pre-processed or even fully processed before Election Day. If the process of verifying the signatures on the envelopes may not begin before 7 a.m. on Election Day, there is no conceivable way they can all be verified, the envelopes opened, and the ballots taken out, prepped, and scanned by midnight. Here is the lay of the land by (swing) state:
- Arizona: Although Arizona is in the Mountain Time Zone, its results may be available long before some of the swing states in the Eastern Time Zone because Arizona law allows processing of all ballots as soon as they are received and they can be counted as soon as they have been processed. The results may not be released until the polls close, though. If a large number of ballots are dropped off in person on Election Day, that could slow the process down.
- Georgia: Not as good as Arizona, but still pretty good. Signatures are verified as the absentee ballots come in, but opening the envelopes may not begin until the third Monday before Election Day. That is to say, Oct. 21. This means that all the absentee ballots arriving before Election Day will be counted before Election Day. Polls close early (7 p.m.) on Election Day. The combination of precounting the absentee ballots and an early closing time in the Eastern Time Zone means that Georgia will probably be the first swing state to report a winner. If it is a blowout either way, that could set the tone for the rest of the night.
- Michigan: In Michigan, in all but the smallest jurisdictions, ballots can be preprocessed and counted starting 8 days before the election. Since polls close at 8 p.m., an hour later than Georgia, most likely Georgia will report first, but Michigan will probably be the second swing state to report. If the same candidate wins both of them, that candidate will probably be in for a good night. However, a Harris (Michigan)/Trump (Georgia) split is probably more likely.
- Nevada: Signature verification can begin as soon as ballots are received and counting can begin 15 days before the election, so absentee ballots will largely be counted before Election Day, as in Arizona. But since Nevada, unlike Arizona, is an all-mail-in-election state, its results might be available even before Arizona’s. That said, the Silver State is one time zone west of Arizona, and no state can release results until the polls are closed, so maybe not.
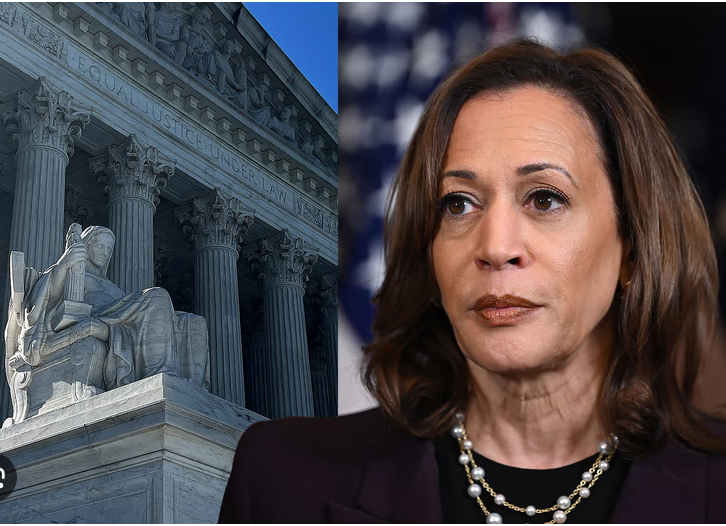
- North Carolina: Oh boy. Hurricane Helene battered the western portion of the state, so the U.S. Supreme Court gets to call the winner. Not officially (yet), but there are sure to be endless lawsuits due to the difficulty in voting for people in the 25 affected counties. Other than that, the state isn’t so bad. Absentee ballots may be verified and put into the tabulating machines 5 weeks before Election Day. Polls close later than in Georgia (7:30 p.m.) but the big problem here is going to be the western part of the state. Still, fairly early on, there will be a big clue how things are going because the biggest cities (Charlotte, Raleigh, Greensboro, Durham, and Winston-Salem) were not hit by the hurricane and it will be possible to compare their vote totals with 2020. Harris must surge here to win the state and the presence or absence of a surge will be known before the western counties report.
- Pennsylvania: Pennsylvania introduced early in-person voting only in 2020, so there is not much experience with it. Unfortunately, early in-person ballots are considered absentee ballots, and these may not be counted until 7 a.m. on Election Day. At least there is no need to verify signatures and open envelopes for the early votes. Still, in a large state that may determine the winner, and where every vote may count, it could take a couple of days to count all the ballots, unless there is an unexpected blowout.
- Wisconsin: As we note above, Wisconsin was the third closest state in 2020 (after Georgia and Arizona). Like Pennsylvania, preprocessing of the ballots may not begin in Wisconsin until the polls open on Election Day. If everything ends up depending on Wisconsin, we likely won’t know for a while who won the Badger State. Wisconsin election officials have begged the state legislature to change the law so they can at least pre-process the ballots and have them stacked up, ready to put in the counting machines at 7 a.m. on Election Day, but Republicans in the legislature have no interest in doing so.
The bottom line here is that Georgia will probably come in first, then Michigan, then the eastern part of North Carolina. If there is a huge blue wave, it will show up in the big cities there and that will be a big clue how the state will go. If there is no blue wave, that will also be obvious fairly early.”
And there we are. Our final indicators are: