
Holy avocado dip, it is now thirteen days until Election Day! Two weeks ago, our one monthish outlook showed advantage still Harris, but signs of a significantly tightening race. Where are we now with less than two weeks to go and early voting underway in 39 states?
Harris maintains a lead in both the Real Clear Politics and 538 national polling averages, though down in both compared to a week ago. In both cases her lead is within the margin of error, but the more solidly founded 538 average shows an unmistakable lead is being maintained:
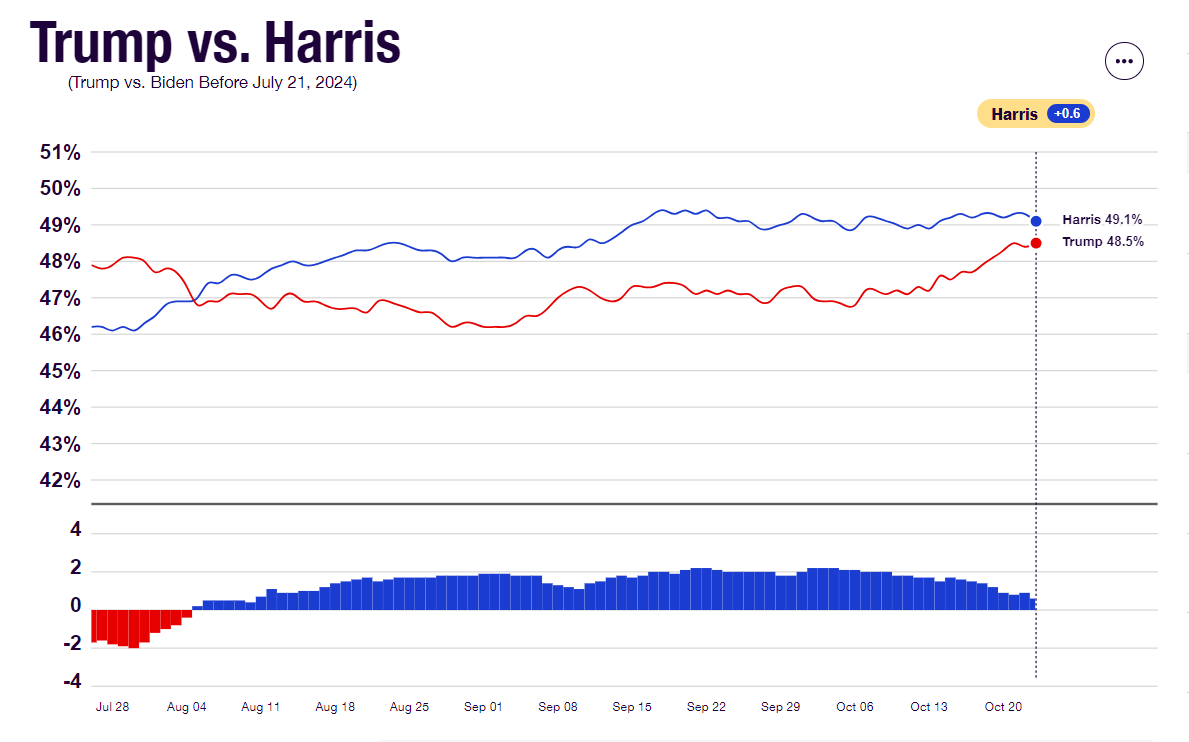
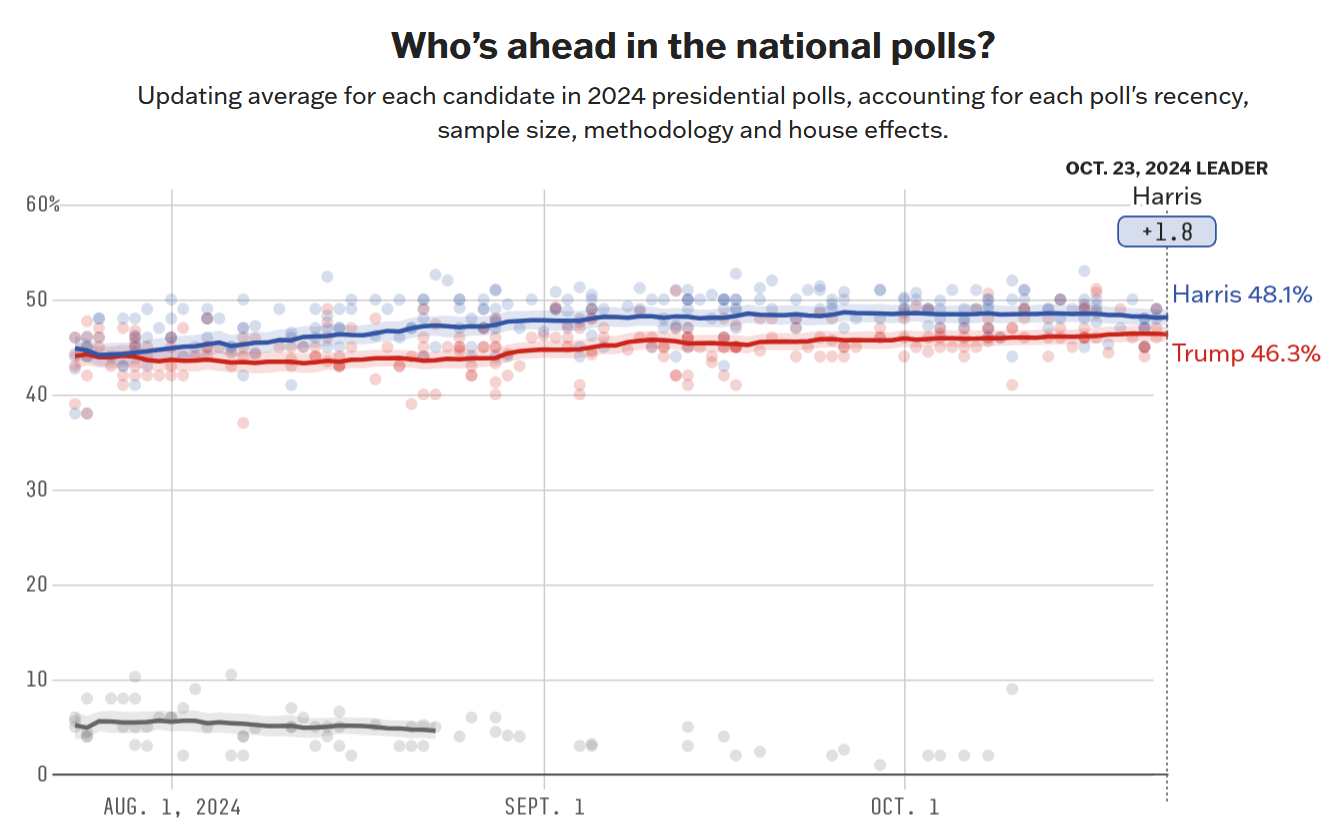
That narrowing margin is significant though, because there’s a point- somewhere in the neighborhood of 2% to 3%- where a Democratic national lead doesn’t necessarily translate into an Electoral College lead anymore because of state by state dynamics and the misproportioned nature of how that system works. On the swing state front, RCP now shows Trump leading all 7 states. 538 has a more robust methodology of weighting polls according to history of pollster accuracy and partisan lean, and it shows a slightly better picture for Harris, but a similar dynamic.
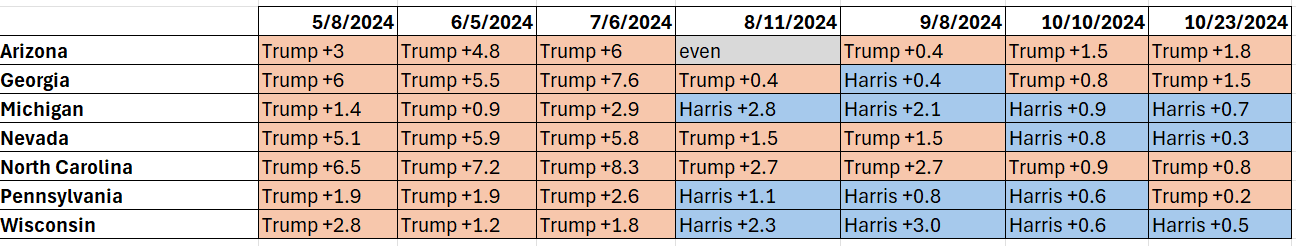
Trump has improved vs. Harris in every state except North Carolina compared to two weeks ago, including pulling into a narrow lead in Pennsylvania, such that he is now ahead in 4 of 7. Another major takeaway from the chart is that none of the leads for either candidate is outside the margin of error, and in 5 of 7 states they’re separated by less than 1%:
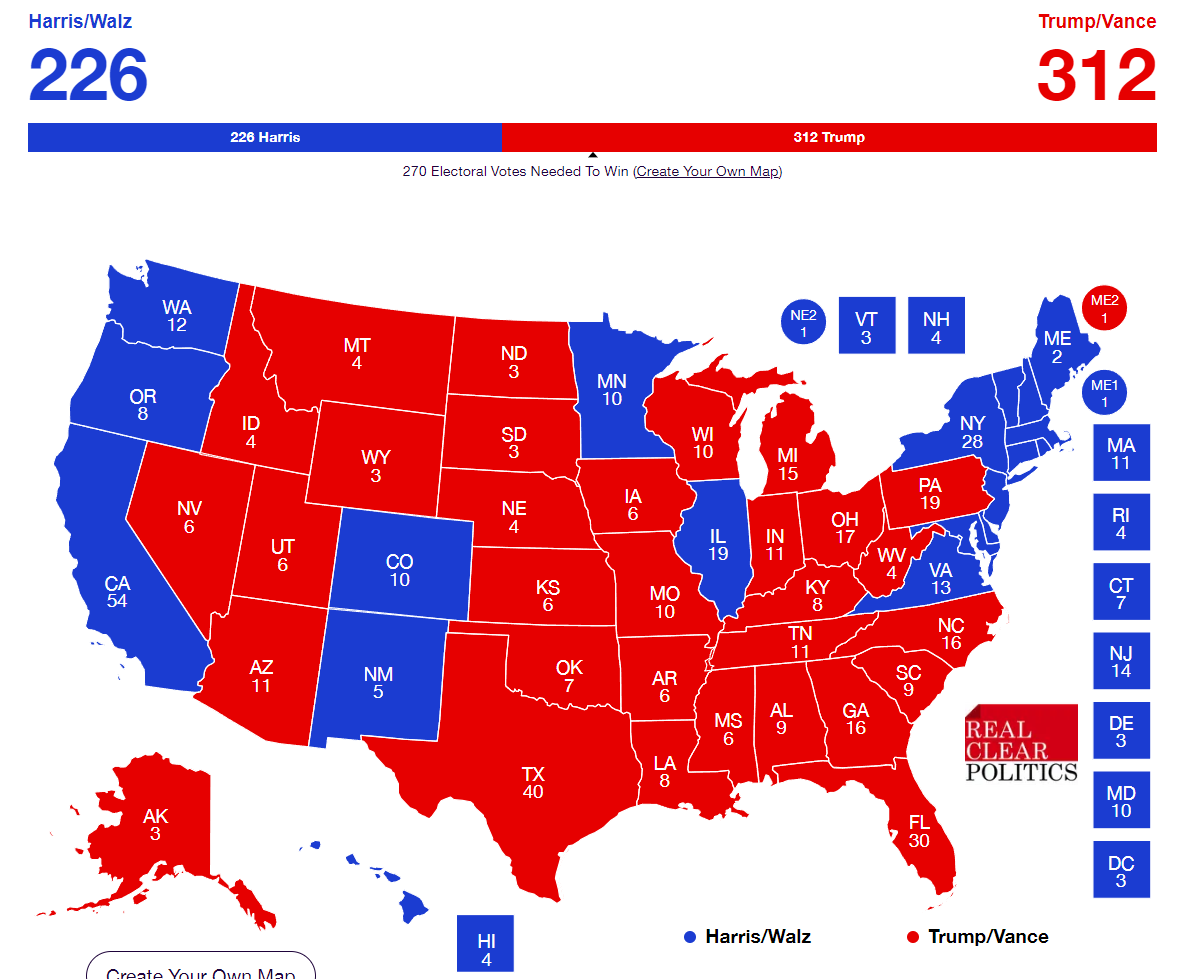
So what does that add up to? RCP has Trump sweeping the Electoral College:
Using the 538 state polls it’s closer, but Trump still tops 270 with room to spare:
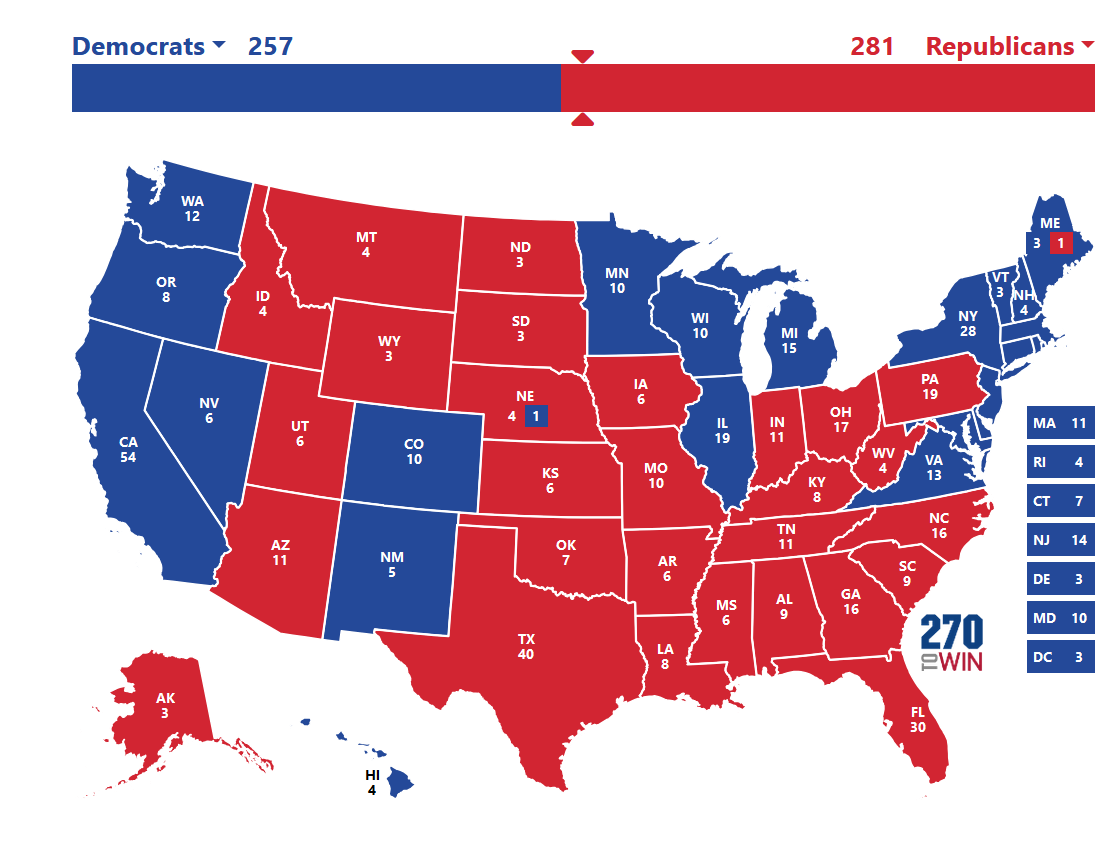
As was noted two weeks ago, though, with all seven swing states within a margin of error, and five of them separated by less than 1%, it would be perfectly plausible to see either Harris or Trump win all seven. The main thing that’s true is that it’s very, very close.
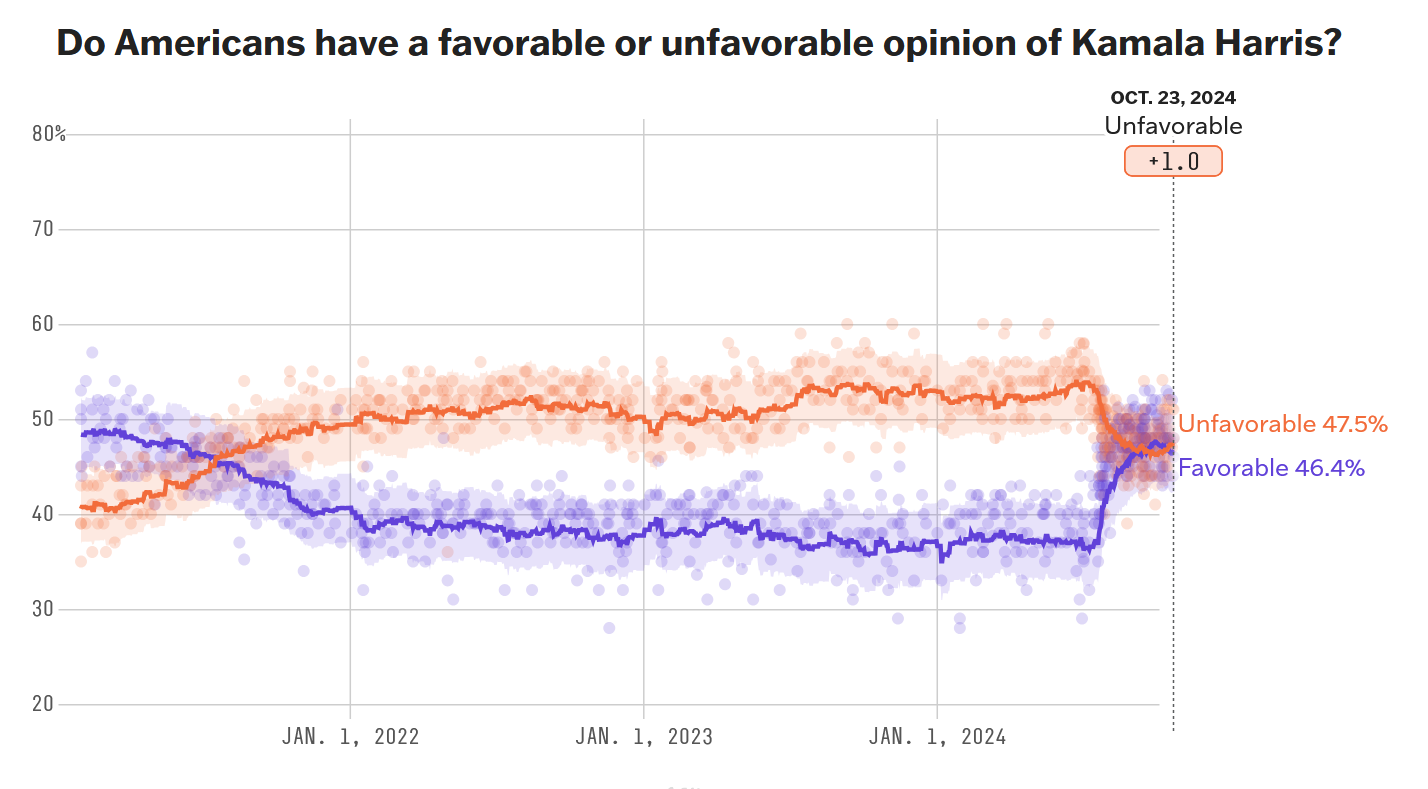
Approval ratings, which are another kind of stand in for preference, still show an edge for Harris, but she’s swung back into net negative territory, and Trump has trended up a bit compared to last time:

Democrats still retain their lead in the Generic Congressional ballot, and are up just a smidge from two weeks ago:

A significant indication of overall strength for Democrats remains that, through 100 special elections over the past two years, the party has outperformed by an average of 6% against the partisan lean of the races in question (per a spreadsheet compiled by Nathaniel Rakich of 538):

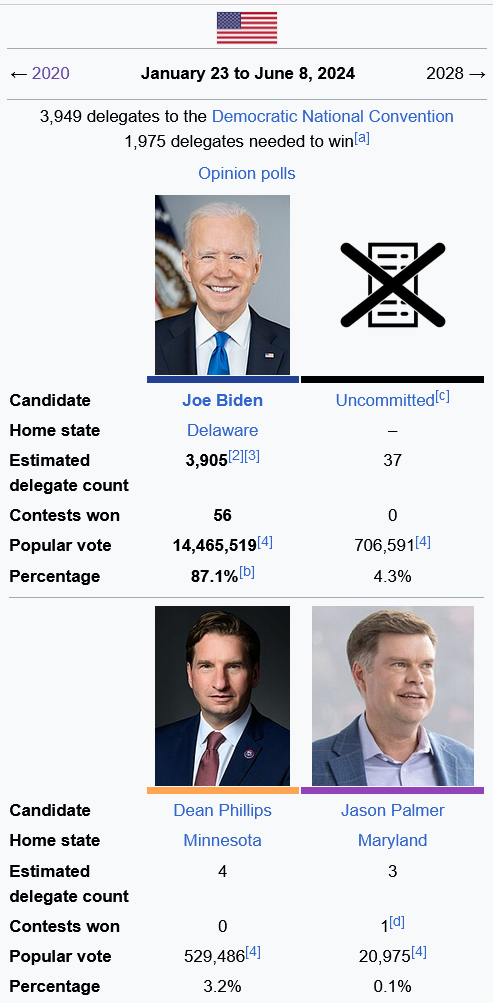
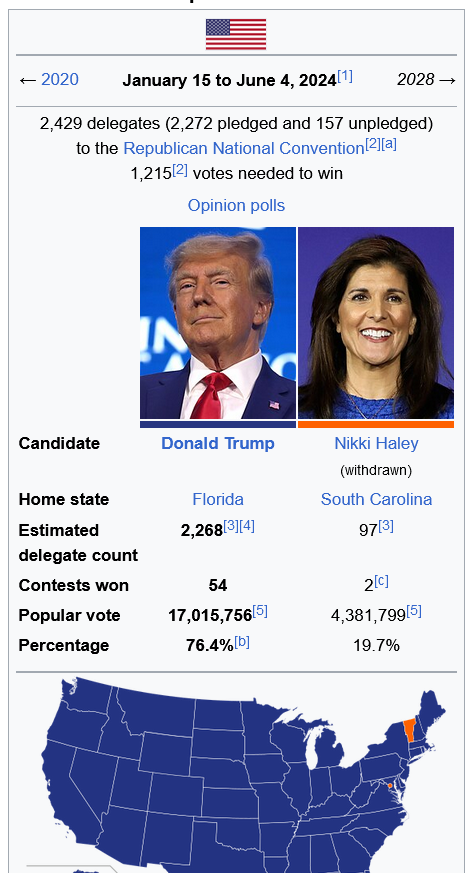
There’s no change in this indicator, but it remains true that Biden’s percentage in Democratic primaries was ahead of Trump’s in Republican primaries, indicating that Republicans had comparatively more wavering partisan supporters to bring home for their nominee:
The betting markets, meanwhile, are now going for Trump in a big way, predicting a more than 60% chance of him winning the election:

Taking all this together, the two main things that stand out compared to two weeks ago are that there’s been movement toward Trump, and everything is converging on being very, very close. And indeed, that’s where our forecast models are coming out. Witness 538:

538’s now solo founder Nate Silver has his model behind a paywall, but does give periodic updates on what it’s saying:

So, as was true two weeks ago, two of the best forecast models out there have the election basically down to a coin toss. Circling back for a second to 538’s state averages:

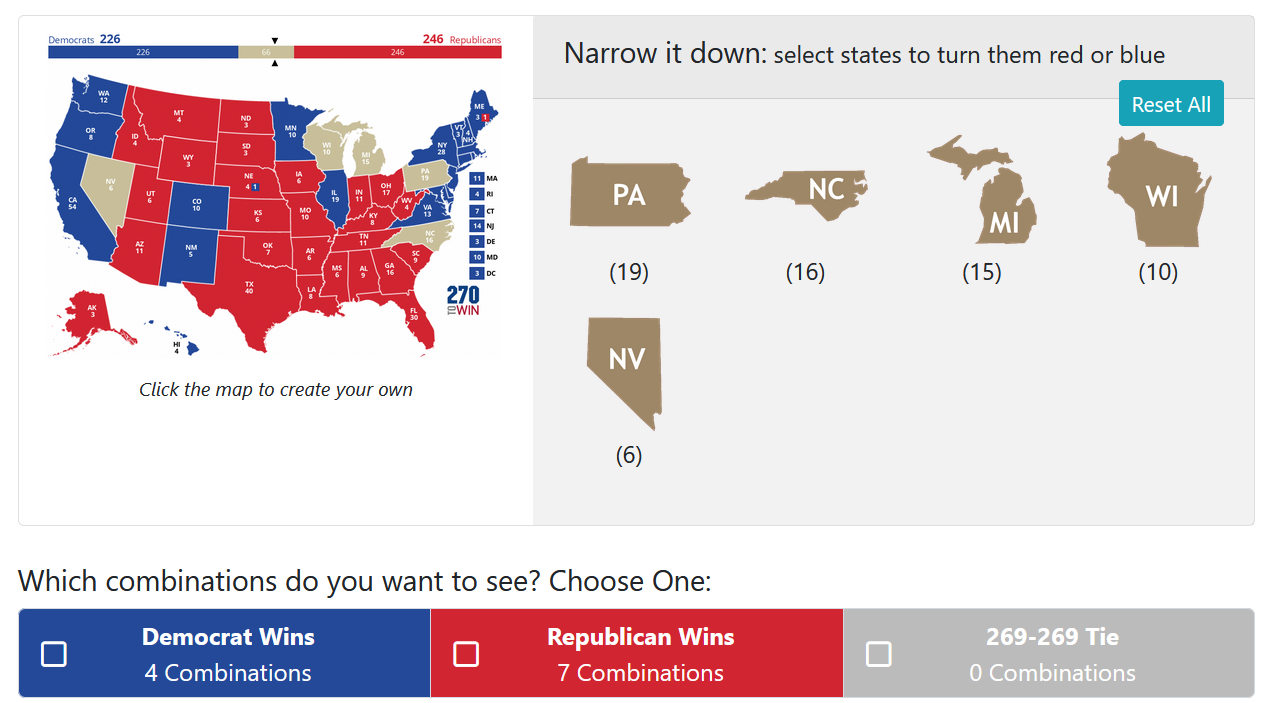
If we do a map that leaves blank the five states that are within 1%, there are four different ways Harris could get there, and seven ways Trump could, any of which might happen by not more than a few thousand votes:
We’ll check in again next week at a week to go to see if things are any clearer. Until then, our indicators are:

